How to Connect Amazon Ads to Google Sheets
Export your Amazon Advertising data to Google Sheets automatically. Track Sponsored Products, Brands, and Display campaigns.
MetricNexus Team

Amazon Advertising is one of the most powerful advertising platforms for e-commerce sellers, generating billions in revenue annually. Yet for all its power, the built-in reporting dashboard has a critical limitation: it siloes your data, making it nearly impossible to combine with other marketing channels or build the comprehensive view you need to scale profitably.
This is where Google Sheets comes in. By connecting your Amazon Ads data to Google Sheets, you unlock the ability to build unified dashboards, track cross-channel metrics, and share insights with your team—without needing to grant everyone access to your Amazon Advertising account.
In this guide, we'll walk through how to connect Amazon Ads to Google Sheets, explain the metrics you need to watch, and show you how to build a dashboard that gives you complete visibility into your advertising performance.
Why Amazon Ads + Google Sheets?
Amazon Advertising's native dashboard is comprehensive, but it's designed for single-channel analysis. For sellers managing multiple marketing channels—Amazon Ads, Google Ads, Facebook, TikTok—the real opportunity lies in understanding how these channels work together.
Here are the key benefits of exporting your Amazon Ads data to Google Sheets:
Combine with Off-Amazon Marketing When you centralize your advertising data in Google Sheets, you can directly compare your Amazon Ads performance against your Google Ads campaigns, Facebook ads, and other channels. This reveals which channels drive the best return and where you should allocate budget next.
Track TACoS (Total Advertising Cost of Sale) Amazon's native dashboard shows ACoS (Advertising Cost of Sale), which only accounts for ad-attributed sales. But your true profitability depends on TACoS—your total ad spend divided by all sales (including organic). Google Sheets lets you calculate TACoS across all channels and understand the full impact of your advertising investment.
Build Multi-Marketplace Reports If you sell in the US, UK, Canada, or EU, you're managing separate ad accounts in each marketplace. Google Sheets makes it simple to roll up data from multiple marketplaces into a single unified report, allowing you to see which markets are performing best.
Share Insights Without Granting Access Not everyone on your team needs—or should have—access to your Amazon Advertising account. By exporting to Google Sheets, you can share read-only reports and dashboards with stakeholders, agency partners, or your accountant without compromising account security.
Automate Repetitive Reporting Manual downloading and combining data is tedious and error-prone. Automating this process saves hours every week and ensures your data is always current.
What Data Can You Export?
Amazon Advertising provides detailed reporting across three main campaign types, plus additional data if you're using Amazon DSP (Demand-Side Platform).
Sponsored Products
Sponsored Products are keyword-targeted ads that appear in Amazon search results. You can export:
- Campaign and ad group performance - Spend, impressions, clicks, and sales by campaign
- Keyword-level metrics - Performance of individual keywords, search terms that triggered your ads, and match type (exact, phrase, broad)
- ACoS and ROAS - Advertising cost of sale and return on ad spend for each keyword and campaign
- Impressions and clicks - Visibility metrics showing how often your ads appeared and how many people clicked
Sponsored Brands
Sponsored Brands (formerly Headline Search Ads) let you showcase multiple products with a custom brand message. Exportable data includes:
- Campaign performance - Overall spend and sales by campaign
- New-to-Brand metrics - The percentage of conversions from customers who haven't purchased from you before, crucial for understanding brand reach
- Video campaign data - Performance of video-based brand ads
- Store spotlight performance - Data from Store Spotlight ads that drive traffic to your Amazon storefront
Sponsored Display
Sponsored Display ads retarget shoppers across Amazon and the web. You can export:
- Audience targeting performance - How ads perform against different audience segments
- Product targeting performance - Results when targeting specific competitor products or categories
- Views, clicks, and conversions - Standard engagement metrics across all display inventory
DSP (Demand-Side Platform)
If you have access to Amazon DSP (available to larger sellers), you can also export:
- Display and video advertising metrics - Across premium publisher inventory
- Audience reach data - Insights into who you're reaching
- Attribution data - How DSP campaigns influence downstream Amazon sales
Note: API access requirements vary by account type. Most professional sellers have access to Sponsored Products, Brands, and Display APIs. DSP data typically requires dedicated account support.
Method 1: Using Automated Tools
The simplest way to connect Amazon Ads to Google Sheets is using a dedicated integration tool. These handle API authentication, data transformation, and schedule syncs automatically.
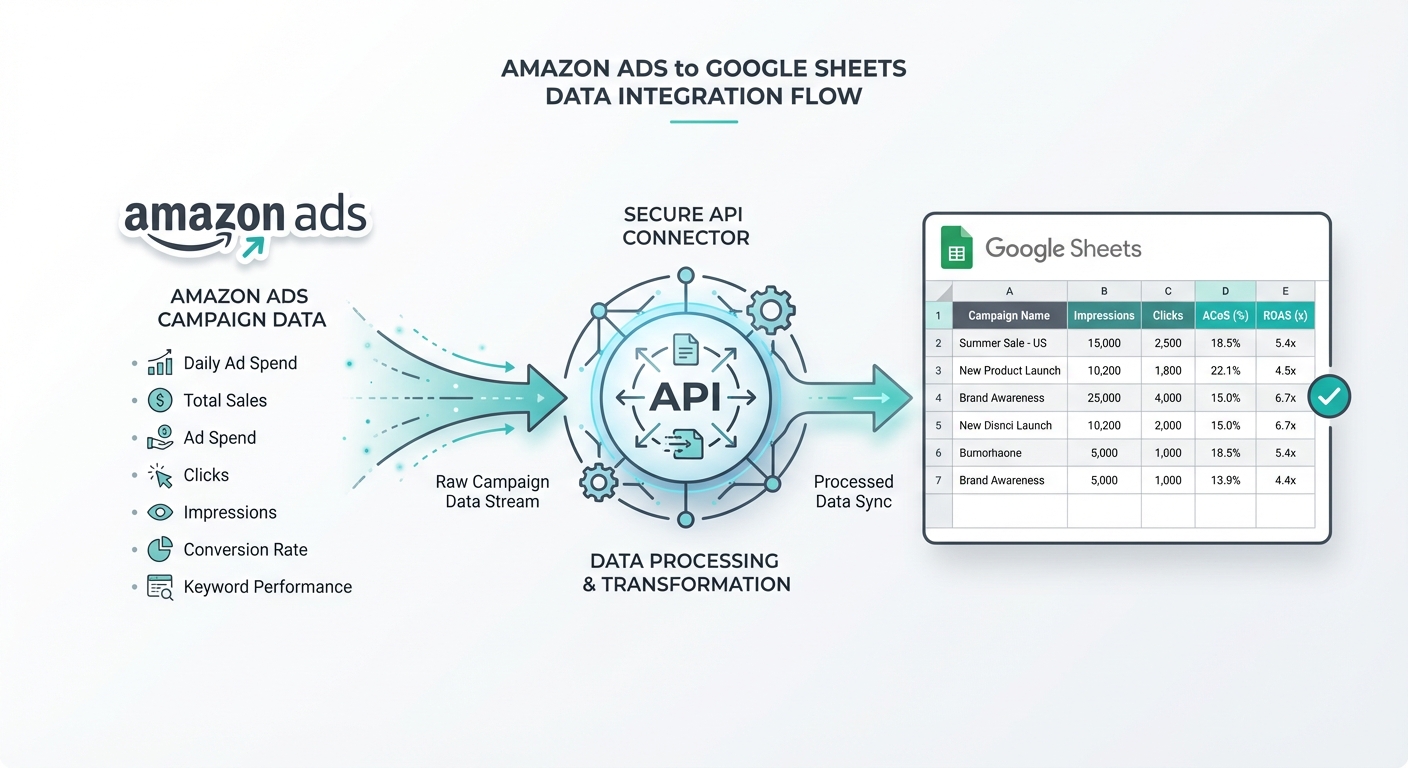 Data flow from Amazon Ads through API to Google Sheets
Step 1: Connect Your Amazon Advertising Account Most tools require you to authenticate your Amazon Ads account via OAuth. This grants the tool permission to read your advertising data without storing your password. The process typically takes 2-3 minutes.
Step 2: Select Reports and Metrics Choose which campaigns, ad types, and metrics you want to sync. Common setups include:
- Daily campaign performance
- Keyword-level data for Sponsored Products
- ASIN-level (product) performance
- Custom metrics like TACoS calculations
Step 3: Connect Your Google Sheet Authorize the tool to edit your Google Sheet. The tool will create a new sheet or append to an existing one with your data.
Step 4: Set Your Sync Schedule Choose how frequently you want data updated—daily is most common for active sellers, though weekly or monthly works for seasonal businesses. Most tools sync overnight to avoid impacting your ad management during active hours.
Advantages:
- No coding required
- Handles API authentication automatically
- Scheduled syncs keep data current
- Often includes built-in templates and dashboards
- Best for non-technical users
Tool Pricing Comparison (2026):
| Tool | Starting Price | Refresh Frequency | Notes |
|---|---|---|---|
| Two Minute Reports | $8-9/month | Hourly | 14-day trial, 40% annual discount |
| Coupler.io | Free tier | Every 15 minutes (paid) | Premium for faster sync |
| Gorilla ROI | ~$99 base | Daily | Order-based tiers, $25/extra account |
| Porter Metrics | Free templates | Hourly | Paid plans for automation |
| Windsor.ai | Volume-based | Hourly (Standard+) | 30-day trial, 193 metrics |
| Supermetrics | EUR 29/month | Daily | Excel/warehouse only for Amazon |
Note: Supermetrics limits Amazon Ads data to Excel, data warehouse, and API destinations due to Amazon's policies. Google Sheets and Looker Studio are not supported for Amazon Ads specifically.
Method 2: Using Amazon Ads API Directly
For developers or technically savvy sellers, the Amazon Ads API offers maximum flexibility and control.
Getting Started with the Amazon Ads API First, you need to register as an Amazon Ads API developer. Visit the Amazon Advertising API documentation and apply for access. This requires:
- An active Amazon seller account
- Approval from Amazon (typically 3-5 business days)
- OAuth setup for your application
API Rate Limits: New API credentials allow up to 1 request per second (1 TPS) and 8,640 requests per day for the first 30 days. Limits increase based on shipped item revenue. Access tokens are valid for one hour and must be refreshed.
2026 API Update: Starting April 30, 2026, Amazon introduces monthly fees for Product Advertising API based on GET call volume, with four tiers: Basic (free), Pro, Plus, and Enterprise.
API Authentication The Amazon Ads API uses OAuth 2.0. Here's a simplified flow:
- Redirect users to Amazon's OAuth endpoint
- User authorizes your app
- Receive a refresh token
- Exchange refresh token for access tokens
- Use access token to make API calls
Example: Pulling Campaign Data with Python
Code block (python)import requests
import json
from datetime import datetime, timedelta

# Your OAuth credentials
CLIENT_ID = "your_client_id"
CLIENT_SECRET = "your_client_secret"
REFRESH_TOKEN = "your_refresh_token"

def get_access_token():
    """Get fresh access token using refresh token"""
    response = requests.post(
        "https://api.amazon.com/auth/o2/token",
        data={
            "grant_type": "refresh_token",
            "client_id": CLIENT_ID,
            "client_secret": CLIENT_SECRET,
            "refresh_token": REFRESH_TOKEN,
        }
    )
    return response.json()["access_token"]

def get_campaign_data(profile_id, date_range_days=7):
    """Fetch campaign performance data"""
    access_token = get_access_token()

    start_date = (datetime.now() - timedelta(days=date_range_days)).strftime("%Y%m%d")
    end_date = datetime.now().strftime("%Y%m%d")

    headers = {
        "Authorization": f"Bearer {access_token}",
        "Amazon-Advertising-API-Scope": profile_id,
        "Content-Type": "application/json"
    }

    payload = {
        "reportDate": end_date,
        "groupBy": "CAMPAIGN",
        "metrics": "impressions,clicks,cost,purchases,purchasedSales"
    }

    response = requests.post(
        "https://advertising-api.amazon.com/v2/reports",
        headers=headers,
        json=payload
    )

    return response.json()

# Get campaign data and print
data = get_campaign_data("your_profile_id")
print(json.dumps(data, indent=2))
Using Google Apps Script
If you prefer not to manage a server, Google Apps Script lets you connect directly from Google Sheets:
Code block (javascript)function fetchAmazonAdsData() {
  const PROFILE_ID = "your_profile_id";
  const ACCESS_TOKEN = getAccessToken(); // Implement OAuth token refresh

  const payload = {
    "reportDate": new Date().toISOString().split('T')[0].replace(/-/g, ''),
    "groupBy": "CAMPAIGN",
    "metrics": "impressions,clicks,cost,purchases,purchasedSales"
  };

  const options = {
    method: "post",
    headers: {
      "Authorization": `Bearer ${ACCESS_TOKEN}`,
      "Amazon-Advertising-API-Scope": PROFILE_ID,
      "Content-Type": "application/json"
    },
    payload: JSON.stringify(payload),
    muteHttpExceptions: true
  };

  const response = UrlFetchApp.fetch(
    "https://advertising-api.amazon.com/v2/reports",
    options
  );

  const data = JSON.parse(response.getContentText());

  // Write to sheet
  const sheet = SpreadsheetApp.getActiveSheet();
  sheet.getRange(1, 1, data.length, Object.keys(data[0]).length)
    .setValues(data);
}
When to Use This Method:
- You need custom data transformations
- You're building a larger data pipeline
- You have specific integration requirements
- You want complete control over the process
Method 3: Manual Export + Import
If you only need occasional reporting or are getting started with data exports, you can manually download reports from Amazon Advertising and import them to Google Sheets.
How to Download Reports from Amazon Advertising:
- Log into your Amazon Ads account
- Navigate to the "Reports" section in the campaign type you want (Sponsored Products, Brands, etc.)
- Select your date range
- Choose metrics: impressions, clicks, cost, sales, ACoS, etc.
- Download as CSV
- Open Google Sheets and use File → Import Sheet to upload the CSV
Limitations of Manual Imports:
- Time-consuming, especially with multiple campaigns or marketplaces
- Error-prone when combining data from multiple sources
- Data becomes stale quickly
- Not scalable as your business grows
When Manual Works:
- You're analyzing a specific period (e.g., Black Friday performance)
- You're doing one-time deep dives into keyword performance
- Your business is very early-stage with minimal ad spend
- You want to verify data before automation
Free Amazon Ads Google Sheets Template
To help you get started, we've created a free template that includes:
- Campaign Performance Overview - High-level view of spend, sales, and ACoS by campaign type
- Keyword Analysis - Deep dive into Sponsored Products keyword performance
- ACoS and TACoS Tracking - Automatic calculations to monitor profitability
- ASIN Performance - Sales and efficiency metrics by product
- Week-over-Week Trends - Charts showing performance trends over time
- Multi-Marketplace Consolidation - Combine US, UK, and EU data in one view
The template is fully editable and includes formulas for common calculations. You can adapt it to your specific needs and campaigns.
Understanding Amazon Ads Metrics
Amazon's native dashboard can be overwhelming with metrics. Here are the ones that matter most for profitability:
ACoS (Advertising Cost of Sale)
Definition: Your ad spend divided by sales attributed to your ads.
Code block (markdown)ACoS = Ad Spend / Ad-Attributed Sales
Example: If you spent $500 on ads and generated $2,500 in ad-attributed sales, your ACoS is 20% ($500 / $2,500).
Why It Matters: ACoS tells you what percentage of your ad-attributed sales goes to paying for those ads. Lower is better.
What's Good: Typical ranges vary by category and product:
- Electronics, media: 15-25% (highly competitive, established demand)
- Beauty, supplements: 20-35% (newer products often require higher spend)
- Commodity items: 10-20% (low margins mean you can't afford high ACoS)
Most sellers target ACoS between 20-30%, but profitability depends on your product margin. If your profit margin is 30%, an ACoS above 20% means losing money on every ad-attributed sale (though organic halo benefits might offset this).
2026 ACoS Trends: Average ACoS is projected at 32-35% in 2026, up from 30.20% in 2025. Top performers maintain 23-26%. This increase reflects growing competition: over 70% of Amazon sellers now actively advertise, up from 40% five years ago.
TACoS (Total Advertising Cost of Sale)
Definition: Your total ad spend divided by total sales (both ad-attributed and organic).
Code block (markdown)TACoS = Total Ad Spend / Total Sales (Organic + Ad-Attributed)
Example: If you spent $500 on ads and made $3,000 total (including $2,500 from ads and $500 organic), your TACoS is 16.7% ($500 / $3,000).
Why It Matters: TACoS is more holistic than ACoS because it accounts for the organic sales your ads help create. Ads don't just drive immediate sales—they increase brand awareness, which leads to organic searches and repeat purchases.
What's Good: TACoS should be well below your profit margin. If you profit 30% per sale, keep TACoS under 15% to stay profitable. Most successful sellers maintain TACoS between 10-20%.
TACoS Benchmarks by Stage:
- Ideal (strong organic presence): 5-10%
- Moderate (growing brands): 10-15%
- Aggressive growth phase: 15-20%
ROAS (Return on Ad Spend)
Definition: Ad-attributed sales divided by ad spend. It's the inverse of ACoS.
Code block (markdown)ROAS = Ad-Attributed Sales / Ad Spend
Example: $2,500 sales / $500 spend = 5x ROAS (for every $1 spent, you make $5).
Relationship to ACoS:
- ROAS of 5x = ACoS of 20% (1 / 5 = 0.20)
- ROAS of 4x = ACoS of 25%
- ROAS of 3x = ACoS of 33%
Use whichever metric your team finds more intuitive. ROAS often feels more positive ("5x return"), while ACoS is more directly tied to profitability.
New-to-Brand (Sponsored Brands Only)
Definition: The percentage of conversions from customers who haven't purchased from your brand in the last 12 months.
Why It Matters: High NTB metrics indicate you're reaching new customers and expanding your brand. Low NTB might mean you're only converting existing customers (less growth opportunity).
What's Good:
- Early-stage brands (new to Amazon): 40-60% NTB is excellent
- Established brands: 20-35% is normal
- Mature brands: 10-20% is typical (most customers are repeat buyers)
Building an Amazon Ads Dashboard in Google Sheets
Once you have your data flowing into Google Sheets, the next step is turning raw numbers into actionable insights. Here's how to structure a comprehensive dashboard:
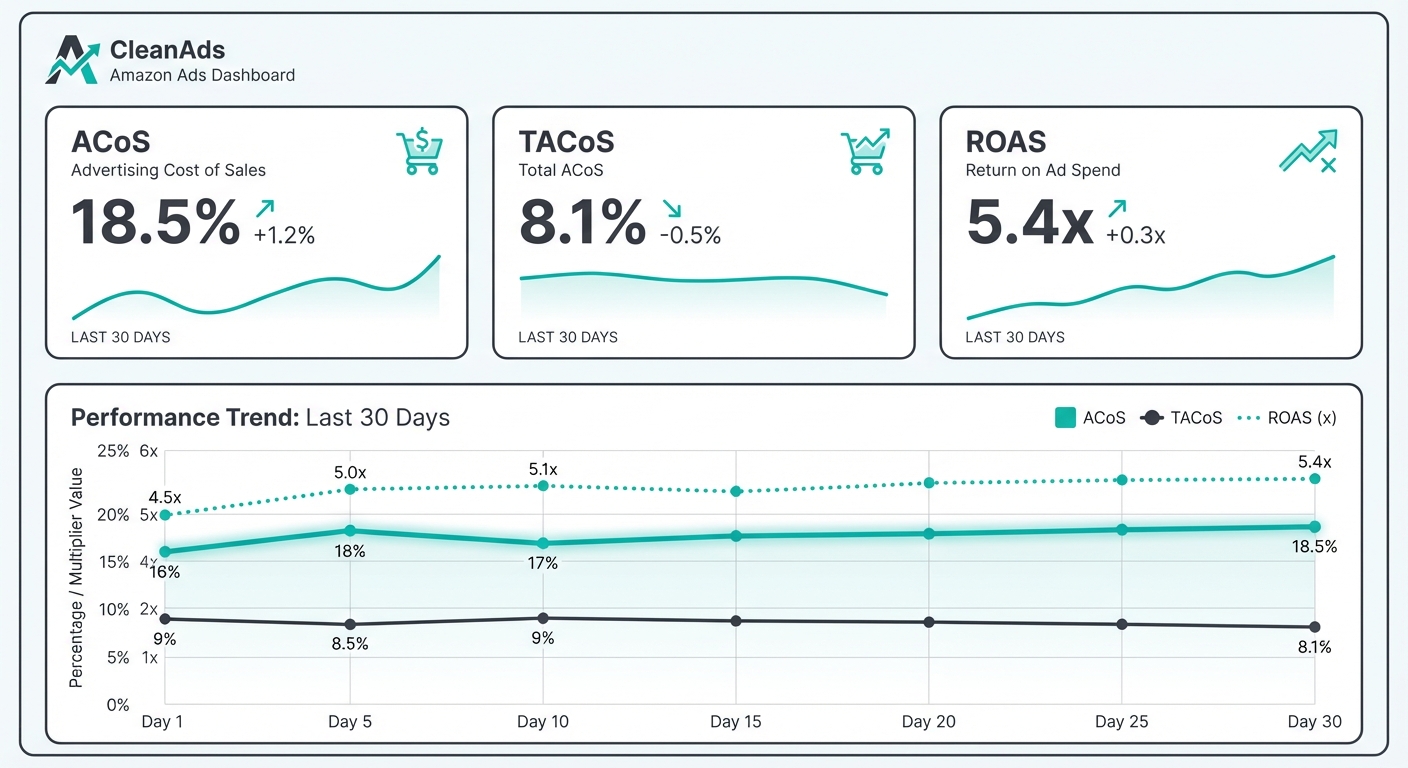 Amazon Ads dashboard showing ACoS, TACoS, and ROAS metrics with trend visualization
Overview Section
Create a high-level summary that answers these questions at a glance:
- Total spend this period - Sum of all ad costs
- Total ad-attributed sales - Revenue from ads
- Overall ACoS - Total spend / total ad-attributed sales
- Overall TACoS - Total spend / total sales (including organic)
- Week-over-week change - How is performance trending?
Use simple formulas to pull this data from your detailed reports. Color-code key metrics: green for good performance, red for concerning trends.
Campaign Analysis Section
Break down performance by campaign type:
| Campaign Type | Spend | Ad Sales | ACoS | TACoS | WoW Change |
|---|---|---|---|---|---|
| Sponsored Products | $3,200 | $18,500 | 17.3% | 14.2% | +5% |
| Sponsored Brands | $1,500 | $12,000 | 12.5% | 10.8% | +2% |
| Sponsored Display | $800 | $3,200 | 25.0% | 18.5% | -8% |
Identify which campaign types perform best. Many sellers find Sponsored Brands deliver the best overall efficiency because they drive new-to-brand sales.
Keyword Analysis Section (Sponsored Products)
For keyword-targeted campaigns, dive deeper:
- Top performers by sales - Which keywords drive the most revenue?
- Most efficient keywords - Which keywords have the lowest ACoS?
- Problem keywords - Which keywords spend a lot but generate minimal sales? These are candidates for pause or bid reduction.
Create a simple scoring system: %%%CODE_BLOCK_5%%%
ASIN Performance Section
Track performance by product:
| ASIN | Product Name | Spend | Sales | ACoS | Organic Sales | Notes |
|---|---|---|---|---|---|---|
| B123ABC | Widget Pro | $1,200 | $8,500 | 14.1% | $5,200 | Top performer |
| B456DEF | Widget Standard | $800 | $4,200 | 19.0% | $2,100 | Stable |
| B789GHI | Widget Lite | $600 | $2,100 | 28.6% | $500 | Underperforming |
This reveals which products justify ad spend and which might need pricing adjustments or improved listings to perform better.
Trend Section
Add charts showing:
- ACoS trend over the last 8 weeks
- Spend vs. sales over time
- TACoS trajectory (is the business becoming more efficient?)
Trends reveal whether you're improving or drifting. A rising ACoS might mean increased competition, while a falling ACoS could indicate successful optimization.
Combining Amazon Ads with Off-Amazon Marketing
The real power of centralizing your data in Google Sheets is the ability to compare channels. Here's how to build a unified multi-channel view:
Set Up Separate Sections for Each Channel
Create sections for:
- Amazon Ads (all types)
- Google Ads (Search, Shopping, Display)
- Facebook/Instagram Ads
- TikTok Shop Ads
- Any other paid channels
Use consistent metrics across channels where possible:
- Spend
- Conversions (or sales)
- Cost per conversion
- ROAS
Understand Attribution Limitations
Important caveat: Amazon is a "walled garden." Amazon attributes sales based on activity within Amazon, but Google, Facebook, and other platforms can't see inside Amazon's ecosystem. This means:
- A customer might click a Facebook ad, then purchase on Amazon without that purchase being attributed to Facebook
- Amazon won't give credit to external channels that influenced the purchase
- Your attribution data will be incomplete
Solution: Track channels separately and focus on efficiency metrics (Cost per Sale) rather than trying to build a perfectly attributed funnel.
Build a Unified Summary
Create a table like this:
| Channel | Spend | Attributed Sales | Cost per Sale | ROAS |
|---|---|---|---|---|
| Amazon Ads | $5,500 | $37,700 | $14.60 | 6.9x |
| Google Ads | $2,800 | $9,100 | $30.77 | 3.3x |
| $1,800 | $5,400 | $33.33 | 3.0x | |
| Total | $10,100 | $52,200 | $19.35 | 5.2x |
This reveals:
- Amazon Ads is your most efficient channel
- You're acquiring customers at an average cost of $19.35
- Your overall ROAS is 5.2x
From here, you might decide to:
- Increase Amazon Ads budget (best performer)
- Test optimizations in Google Ads and Facebook
- Or maintain balanced portfolio (each channel reaches different audiences)
Amazon Ads Performance Benchmarks
Here's what "good" performance looks like across different metrics and categories:
ACoS Benchmarks
| Metric | Below Average | Average | Good | Excellent |
|---|---|---|---|---|
| ACoS (General) | >35% | 25-35% | 15-25% | <15% |
| Commodity Products | >25% | 15-25% | 10-15% | <10% |
| Luxury/Niche | >40% | 30-40% | 20-30% | <20% |
Categories vary significantly. A commodity item (like batteries) might have 10% ACoS, while a niche item (like specialized fitness equipment) might need 35% to be profitable.
2026 Category-Specific ACoS Averages:
| Category | Average ACoS | Notes |
|---|---|---|
| Electronics | ~25% | High competition, established demand |
| Home & Kitchen | 20-25% | Moderate competition |
| Apparel | ~35% | Higher returns, seasonal variation |
| Beauty & Personal Care | 25-35% | New products require more spend |
| Grocery | 15-20% | Lower margins require efficiency |
Click-Through Rate (CTR) Benchmarks
| Campaign Type | Below Average | Average | Good |
|---|---|---|---|
| Sponsored Products | <0.3% | 0.3-0.6% | >0.6% |
| Sponsored Brands | <0.4% | 0.4-0.8% | >0.8% |
| Sponsored Display | <0.1% | 0.1-0.3% | >0.3% |
Higher CTR means your ads are relevant to searchers. Low CTR often indicates poor keyword targeting or weak ad copy.
Conversion Rate Benchmarks
| Metric | Below Average | Average | Good |
|---|---|---|---|
| Conversion Rate | <3% | 5-10% | >10% |
Conversion rate varies wildly by product type and customer intent. A best-selling item with 1000+ reviews might convert at 15%, while a new product might convert at 2% until reviews accumulate.
Remember: These are guidelines, not absolutes. Your industry, product type, and business stage all affect what's "good."
Common Issues and Troubleshooting
"I can't access the Amazon Ads API"
Cause: You don't have API access enabled or your application wasn't approved.
Solution:
- Log into your Amazon Seller Central
- Go to Apps & Services → Develop Apps
- Register your application and request API access
- Wait for Amazon approval (3-5 business days)
- Generate OAuth credentials
Some seller types (Vendor Central, newer accounts) may not have immediate access. Contact Amazon Advertising support if you've waited over a week.
"My data is delayed"
Cause: Amazon has a reporting lag of 24-72 hours.
Solution:
- Schedule automation for early morning (after overnight sync)
- Don't expect real-time data
- Use data for analysis and optimization, not minute-by-minute monitoring
"My sales numbers in Google Sheets don't match Amazon Ads"
Cause: Reporting window differences. Amazon tracks ad-attributed sales within a 7-day window after a click.
Solution:
- Compare data from the same period
- Remember that sales attributed today may include clicks from the past 7 days
- For accurate daily analysis, use the same reporting window as Amazon
"I'm not getting data from all my marketplaces"
Cause: Each Amazon marketplace (US, UK, CA, EU, etc.) is separate. You have separate ad accounts in each.
Solution:
- Pull reports separately for each marketplace
- Combine in your Google Sheet using marketplace identifiers
- Check that your API credentials have access to all profiles
Multi-Marketplace Reporting for International Sellers
If you sell across multiple Amazon marketplaces, centralizing reporting becomes critical. Here's how to set it up:
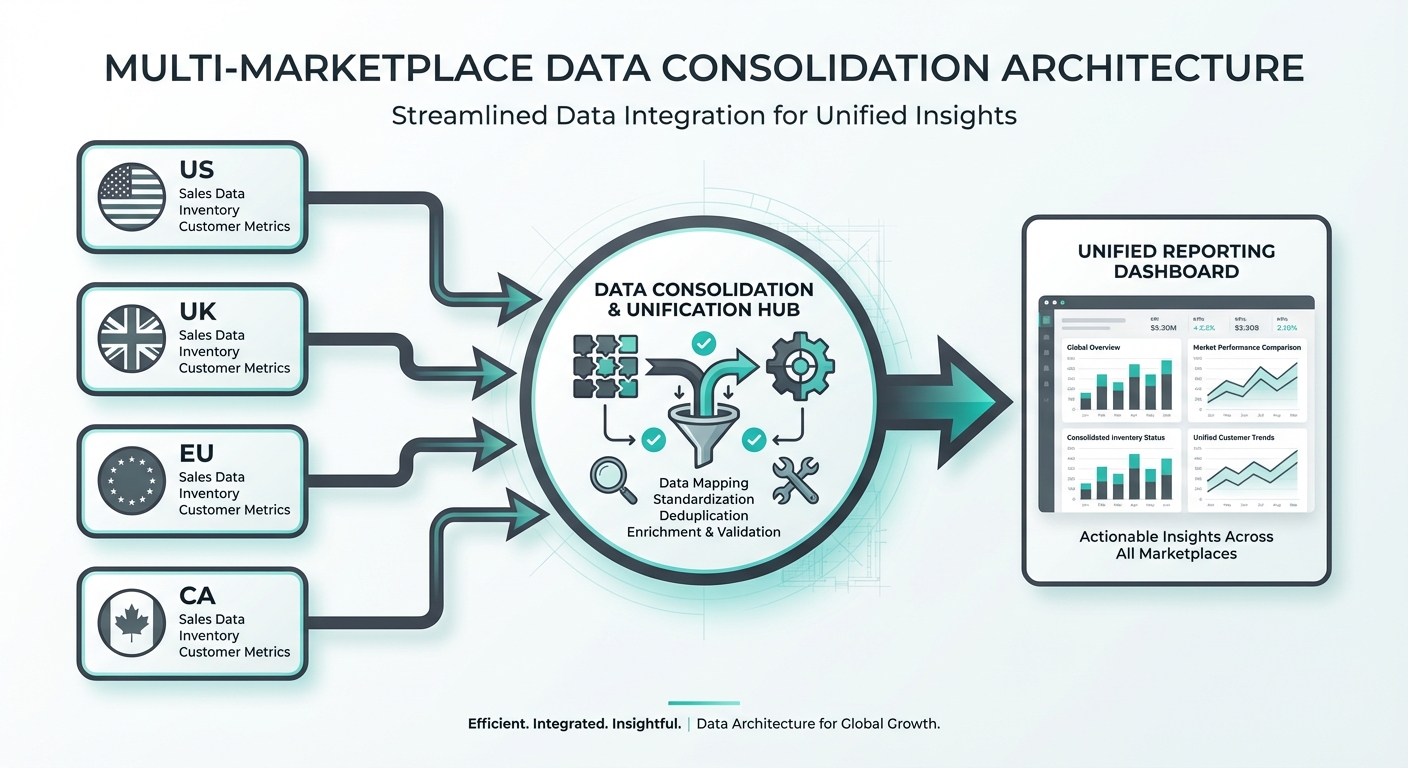 Multi-marketplace data consolidation from US, UK, EU, and CA into unified reporting
Create a Multi-Marketplace Template
Structure your sheet with a "Marketplace" column to organize data:
| Date | Marketplace | Campaign | Spend | Sales | ACoS |
|---|---|---|---|---|---|
| 2026-03-14 | US | SP Brand Awareness | $450 | $3,200 | 14.1% |
| 2026-03-14 | UK | SP Brand Awareness | $120 | $650 | 18.5% |
| 2026-03-14 | EU | SP Brand Awareness | $85 | $420 | 20.2% |
Handle Currency Differences
If your currencies differ by marketplace, convert to a single currency for consolidated reporting:
| Marketplace | Spend (Local) | Exchange Rate | Spend (USD) |
|---|---|---|---|
| US | $500 | 1.0 | $500 |
| UK | £250 | 1.27 | $317.50 |
| CA | $650 CAD | 0.74 | $481 |
| Total | $1,298.50 |
Use current exchange rates or lock in a monthly rate for consistent month-to-month comparisons.
Consolidate Performance Metrics
Create summary tables:
| Marketplace | Spend | Sales | ACoS | Market Share |
|---|---|---|---|---|
| US | $8,500 | $61,000 | 13.9% | 54% |
| UK | $2,100 | $12,300 | 17.1% | 17% |
| CA | $1,800 | $9,500 | 18.9% | 13% |
| EU | $1,600 | $8,200 | 19.5% | 15% |
This reveals which markets are most profitable and whether you should increase or decrease investment in each.
FAQ
Q: Can I automate Amazon Ads to Google Sheets for free?
A: Google Sheets is free, but automating the connection requires either: (1) an integration tool (usually $50-300/month), (2) your own development work using the Amazon Ads API, or (3) manual exports. Free tools exist but often have limitations on update frequency or data access.
Q: How do I calculate TACoS if I don't have total sales data?
A: You'll need to pull total sales from your Amazon Seller Central reports. In Seller Central, go to Reports → Business Reports → Sales Dashboard to get total sales figures, then combine with your Amazon Ads data in Google Sheets.
Q: What's a good ACoS I should target?
A: That depends on your profit margin. A rough rule: Target ACoS should be 30-50% of your profit margin. If you make $30 per sale, target ACoS of 15% or less. The key is that (Profit per Sale × 1.5) > ACoS.
Q: How do I combine Amazon Ads data with inventory and profitability data?
A: Add columns to your product-level performance sheet:
- From Amazon Ads: Sales, spend, ACoS
- From Seller Central: COGS, inventory, profit margin
- Calculated: Profit per sale, true profitability of ads
This reveals which products are worth advertising (high profit ads) vs. which ones need pricing changes or improved listings.
Q: Can I automate alerts when ACoS gets too high?
A: Yes. In Google Sheets, use conditional formatting or Data Validation to highlight cells that exceed thresholds. Or use Gmail notification automation with Apps Script to alert you when metrics drift.
Q: How often should I check my Amazon Ads data?
A: Check high-level metrics daily or weekly (are we on track for spend/sales goals?). Deep analysis of keywords and ASINs works best weekly or monthly (daily changes are noise). Major decisions (pausing campaigns, reallocating budget) should happen monthly or quarterly.
Next Steps
You now have the knowledge to connect Amazon Ads to Google Sheets and build a proper reporting infrastructure. Here's your action plan:
- Choose your method - Tool (easiest), API (most control), or manual exports (quickest to start)
- Set up your first report - Start with campaign-level data, add keyword detail later
- Add other channels - Once Amazon is flowing, bring in Google Ads and Facebook data
- Automate it - Move from manual to scheduled syncs to save hours each week
- Build dashboards - Create visual summaries for decision-making
- Optimize based on data - Use your insights to pause underperformers and scale winners
The sellers who win on Amazon in 2026 are those who understand their profitability at the keyword level and can quickly shift budget to their best performers. A proper Google Sheets setup gives you that visibility.
Start with one marketplace, one campaign type, and one metric. Once that's working, expand. Most sellers find that automating their Amazon Ads reporting saves 5-10 hours per month—hours you can spend optimizing campaigns instead of copying data.
Related Posts

How to Connect Shopify to Google Sheets (E-commerce Data)
Automatically sync your Shopify store data to Google Sheets. Track orders, products, customers, and marketing performance.

E-commerce Marketing Dashboard: Shopify + All Ad Platforms
Build a complete e-commerce marketing dashboard combining Shopify, Google Ads, Meta Ads, and TikTok. Free template included.

How to Connect TikTok Ads to Google Sheets
Automatically sync your TikTok Ads data to Google Sheets. Step-by-step setup guide with free template for campaign reporting.
Ready to see your marketing data?
Start your free trial today. See your data in 5 minutes.
Start Free Trial