E-commerce Marketing Dashboard: Shopify + All Ad Platforms
Build a complete e-commerce marketing dashboard combining Shopify, Google Ads, Meta Ads, and TikTok. Free template included.
MetricNexus Team

If you're running an e-commerce store, you're familiar with the frustration: Shopify shows one revenue number, Meta Ads claims responsibility for a different amount, Google Ads has its own version, and TikTok is somewhere in the mix. When you try to calculate your true return on ad spend (ROAS), the numbers don't align with reality.
This is the e-commerce data problem, and it's costing you time and money in wasted marketing spend.
The solution isn't to choose one data source—it's to build a unified dashboard that combines Shopify (your source of truth for revenue) with data from all your ad platforms (Google Ads, Meta, TikTok, Pinterest) to calculate your actual blended ROAS.
In this guide, we'll walk you through the entire process: why your numbers don't match, what metrics actually matter, how to calculate true blended ROAS, and step-by-step instructions for building a dashboard that shows you the complete picture of your e-commerce marketing performance.
The E-commerce Data Problem
Let's be specific about what's happening with your marketing data right now.
Shopify shows you've generated $50,000 in revenue this month. This is ground truth. Money came into your business. You can see the orders, the customers, the products sold. Shopify's revenue number is reliable.
But Google Ads shows $20,000 in attributed revenue. Meta shows $18,000. TikTok shows $8,000. Pinterest shows $5,000. These numbers add up to $51,000—more than your actual revenue. So someone is lying, right?
Not exactly. They're each telling their own version of the truth based on how they track customer journeys. If someone clicked a Google ad three weeks ago, abandoned the site, came back through a Meta ad last week, and finally purchased, each platform claims credit. The customer saw the ad, but platforms disagree on which one deserves attribution.
This means you can't answer the most important question a marketing leader needs to answer: What's my actual ROAS across all channels?
You can't just add up platform-reported revenue (you'd get $51,000 / $15,000 spend = 3.4x ROAS, which is imaginary). You can't cherry-pick one platform's data (that ignores the impact of your other channels). You're stuck guessing, and guessing usually leads to cutting budgets from your best-performing channels and wasting money on your worst ones.
What Your Dashboard Should Answer
A good e-commerce marketing dashboard answers five critical questions:
-
What's my blended ROAS across all channels? Not platform-attributed ROAS, but true ROAS based on actual revenue generated and actual ad spend.
-
Which platform is actually driving sales? Is it Google's long-tail traffic, Meta's retargeting, or TikTok's impulse buys? You need to understand channel contribution even if attribution is imperfect.
-
Where should I increase or decrease spend? If Google is delivering efficient traffic at 2x ROAS and Meta is at 1.2x, you need to shift budget. But this only works with real data.
-
How is this month comparing to last? Are your channels getting more or less efficient? Is your ROAS trending up or down? What changed?
-
What products should I promote? Which products drive the highest margins? Which ones have the cheapest customer acquisition? Which ones are under-marketed?
These questions lead to decisions: shift budget, pause underperforming products, increase inventory for best sellers, adjust pricing, double down on your most efficient channel. You're making decisions worth thousands of dollars each month. You need data to back them up.
Dashboard Architecture: How the Data Flows
Your dashboard needs to pull data from multiple sources and reconcile them in one place. Here's the architecture:
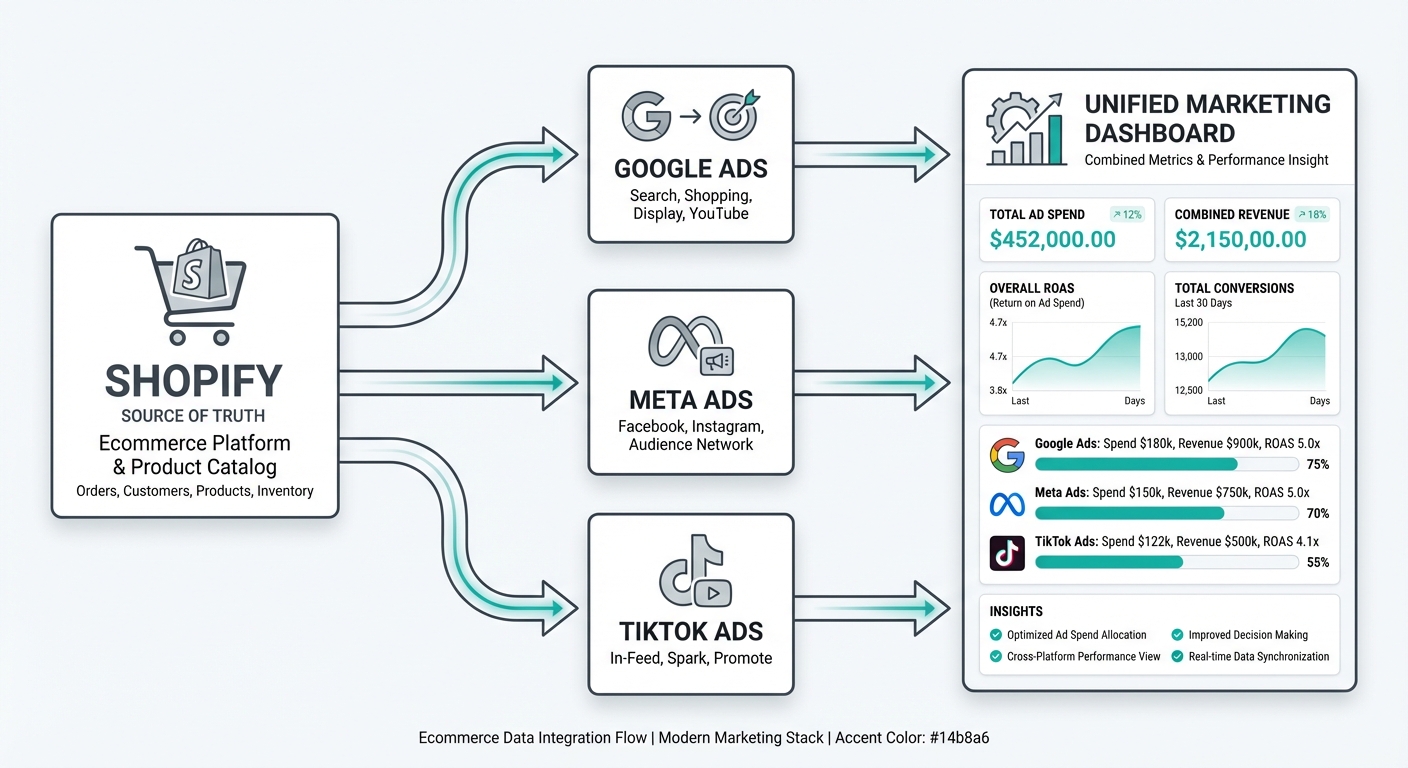 Ecommerce data flow showing Shopify as source of truth connecting to Google Ads, Meta Ads, and TikTok Ads, all feeding into a unified dashboard
The key principle: Shopify is your source of truth for revenue. All your ad platforms report spend, clicks, and impressions. You aggregate the spend data, use Shopify's revenue number, and calculate everything from there.
Why? Because Shopify is the one system that touches actual money. Every order in Shopify is verified—it's either in your bank account or refunded. Ad platforms are guessing about attribution. Shopify knows.
Option 1: MetricNexus Dashboard
If you want a turnkey solution that handles all the data integration and calculation for you, MetricNexus dashboard is designed specifically for e-commerce stores like yours.
What it does:
- Connects directly to your Shopify store and all ad platforms (Google, Meta, TikTok, Pinterest)
- Pulls data automatically every day
- Calculates blended ROAS across all channels
- Shows you which channels are actually profitable
- Surfaces product performance insights
- Sends alerts when ROAS drops or trends change
Setup is straightforward:
- Connect Shopify: Authorize access to your Shopify store (read-only, same permissions as other analytics tools)
- Connect ad platforms: Authenticate with Google Ads, Meta Ads Manager, TikTok Ads Manager, etc. (read-only access)
- Configure your dashboard: Choose which metrics to display, set ROAS targets, define customer acquisition cost targets
- Enable alerts: Get notified if ROAS drops below your target or ad spend is pacing unexpectedly
Within 24 hours, your dashboard is live. You stop logging into five different platforms and instead check one unified view every morning.
The biggest advantage: MetricNexus handles attribution reconciliation automatically. If platform ROAS numbers add up to more than actual revenue (they always do), the dashboard shows you realistic blended ROAS and explains the difference.
Option 2: Google Sheets + Looker Studio (DIY Approach)
If you prefer building your own dashboard, or you need to integrate it with other tools you're already using, the Google Sheets + Looker Studio approach works well for stores up to about $1M/year.
What you'll need:
- Google Sheets (free)
- Looker Studio (free)
- Data connectors for Shopify, Google Ads, Meta (some are free, some are paid)
The workflow:
-
Pull data into Google Sheets: Use connectors like Supermetrics, Zapier, or native Google Connectors to automatically pull:
- Shopify revenue (by date)
- Google Ads spend (by campaign)
- Meta Ads spend (by campaign)
- TikTok Ads spend (by campaign)
-
Create calculated columns: In Sheets, add formulas to calculate:
- Total spend = Google + Meta + TikTok
- Blended ROAS = Revenue / Total Spend
- MoM growth = This month ROAS / Last month ROAS
-
Connect to Looker Studio: Once your Sheets data is organized, connect Looker Studio as the visualization layer. Build:
- Executive summary cards (total revenue, total spend, blended ROAS, MoM change)
- Channel comparison bar charts
- Product performance tables
- Daily trend lines
-
Automate the connectors: Set them to refresh daily so your dashboard always shows current data
The tradeoff: This approach is free and flexible, but it requires more setup and ongoing maintenance. If Google changes their connector API, you might need to adjust your formulas. It's more work, but it's completely under your control.
Option 3: Third-Party Analytics Platforms
If you're scaling beyond $1M/year or need advanced attribution, dedicated ecommerce analytics platforms handle the heavy lifting.
Triple Whale ($129+/month) works best for Shopify stores doing $10-40M annually. Mobile-first design, post-purchase survey integration for attribution, and a clean profit dashboard. The free tier includes basic metrics; paid tiers unlock multi-touch attribution and creative analytics.
Northbeam ($1,000+/month) targets larger operations ($40M+ revenue) running complex multi-channel campaigns. Platform-agnostic (works with Shopify, WooCommerce, Magento), excels at media mix modeling and offline-inclusive attribution. Steeper learning curve but more sophisticated analysis.
Polar Analytics focuses on DTC brands wanting real-time data without data engineering overhead. Pulls from Shopify, ad platforms, and Klaviyo into unified dashboards with one-click setup.
Elevar takes a different approach: server-side tracking that pushes clean conversion data to 50+ platforms. It doesn't replace your dashboard but ensures the data feeding your dashboard is accurate by bypassing ad blockers and browser restrictions.
The right choice depends on your scale and complexity. Under $500K/year, Google Sheets works fine. $500K-$5M, consider Triple Whale or Polar. Above $5M with complex attribution needs, Northbeam or a custom solution makes sense.
Free E-commerce Dashboard Template
To help you get started, we've created a free template you can copy right now. It includes:
- Revenue overview section: Total revenue, revenue by platform attribution, day-over-day and month-over-month growth
- Blended ROAS calculation: Shows both platform ROAS and actual blended ROAS side-by-side so you see the difference
- Channel comparison table: Each ad platform's spend, clicks, conversions, and efficiency
- Product performance grid: Top sellers, highest margin products, customer acquisition cost by product
- Customer acquisition metrics: New vs. returning customer revenue, repeat purchase rate, estimated customer lifetime value
- Trend analysis: 30-day graphs showing if ROAS is trending up or down
The template is built in Google Sheets and connects to Looker Studio for visualization. It's ready to connect to your actual data sources. Download the template here.
Essential E-commerce Metrics Explained
Not all metrics are created equal. Some tell you what happened. The best metrics tell you what to do next.
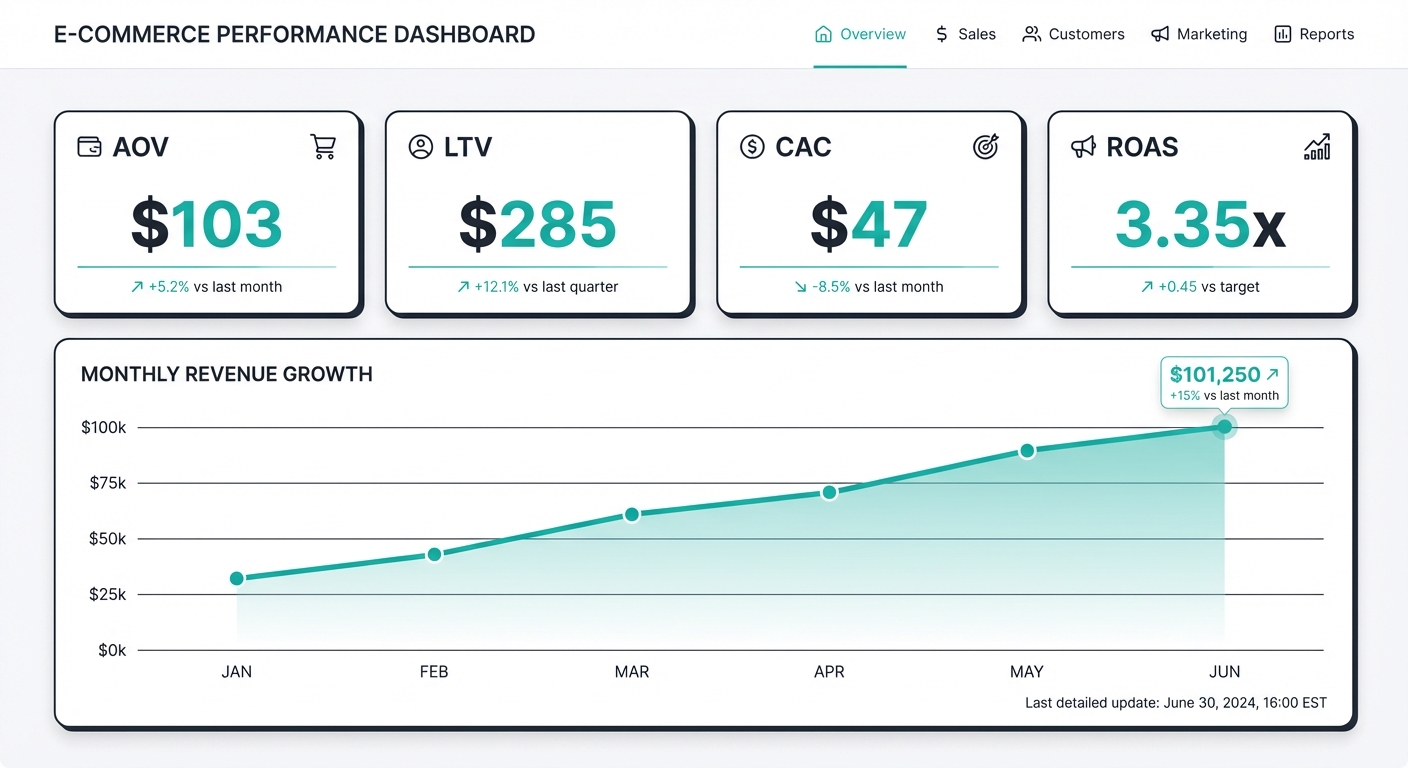 E-commerce dashboard showing key metrics: AOV $103, LTV $285, CAC $47, ROAS 3.35x with monthly revenue trends
Revenue Metrics
Gross Revenue: The total money customers paid, before refunds and chargebacks. This is what Shopify reports.
Net Revenue: Gross revenue minus refunds and chargebacks. For e-commerce, you should track both. Gross tells you about customer demand. Net tells you about customer satisfaction (high refund rates are a warning sign).
Revenue by Channel (Attributed): Even though attribution is imperfect, it's still useful to see which platforms are receiving credit for sales. This helps you understand where customers are coming from, even if they're not 100% accurately attributed.
Average Order Value (AOV): Total revenue / number of orders. A healthy e-commerce store sees AOV increase over time as you optimize pricing, bundling, and upsells. If your AOV is dropping, it might mean lower quality traffic.
Revenue per Visitor: Total revenue / unique visitors. This combines conversion rate and AOV into one metric. It shows how well you're monetizing your traffic. If this is dropping, either your conversion rate or your AOV (or both) is declining.
Acquisition Metrics
Customer Acquisition Cost (CAC): Total ad spend / number of new customers. If you spent $5,000 and acquired 100 new customers, your CAC is $50.
CAC by Channel: Same calculation, but broken down by platform. You need to know if Google's CAC is $35 and Meta's is $65—that tells you where to focus.
New vs. Returning Revenue: Track the percentage of your revenue coming from new customers vs. repeat purchases. A healthy store is 70% new, 30% repeat (or better). If this ratio is worsening, your customer retention is declining.
First-Time Purchaser Rate: Percentage of orders from first-time customers. This matters because first-time customers have high CAC, but if they stick around and buy again, that CAC gets amortized. A declining first-time purchaser rate suggests you're hitting saturation in your addressable market.
Marketing Efficiency
Blended ROAS: Total revenue from all sources / total ad spend. This is your north star metric. For e-commerce, a blended ROAS of 2x-4x is healthy, depending on your margins. If you have 50% margins, you need at least 2x ROAS to be profitable.
ROAS by Platform: Revenue attributed to each platform / spend on that platform. Remember, this will usually be higher than blended ROAS because platforms over-attribute.
Marketing Efficiency Ratio (MER): Total revenue / total marketing spend (including ad platforms, email tools, influencers, SMS, etc.). MER is useful because it shows the efficiency of your entire marketing operation, not just paid ads. A MER of 4x means for every dollar you spend on marketing, you generate $4 in revenue.
Ad Spend as % of Revenue: Total ad spend / total revenue. For e-commerce, this typically runs 15%-40% depending on your industry and margins. If your ad spend is 50% of revenue, you're not profitable (unless you have exceptional lifetime value).
Product Metrics
Top Sellers by Revenue: Which products generate the most absolute revenue? These are your volume drivers. Make sure you're stocking them and bidding on them.
Top Sellers by Margin: Which products have the highest margins? These might not be your biggest revenue generators, but they're your most profitable. You should be promoting these.
Underperforming Products: Which products get traffic but few conversions? Maybe they need better imagery, pricing adjustment, or removal entirely.
Promotion Effectiveness: When you run a promotion, are sales increasing proportionally? If you run a 20% off sale, do you see a 20% revenue increase (which means you're cannibalizing margin) or a 50% increase (which means the promo is working)?
Calculating Blended ROAS
This is the most important metric to understand, so let's break it down completely.
The Formula:Code block (markdown)Blended ROAS = Total Revenue / Total Ad Spend
That's it. But the implementation matters.
A Real Example:
Let's say your Shopify dashboard shows:
- Total orders: 487
- Total revenue: $50,240
- (This includes all traffic sources—organic, direct, email, ads, everything)
Your ad platform dashboards show:
- Google Ads spend: $5,000
- Meta Ads spend: $8,000
- TikTok Ads spend: $2,000
- Total ad spend: $15,000
Your blended ROAS: %%%CODE_BLOCK_1%%%
For every dollar you spent on ads, you generated $3.35 in revenue.
Why This Matters:
If your profit margins are 30%, then you need at least $3.33 in revenue for every $1 in ad spend just to break even (since $3.33 × 30% = $1). Your 3.35x ROAS is just barely profitable—you're making a few cents per dollar spent.
If you raise your ad spend by 50% next month ($22,500), assuming ROAS stays constant, you'd generate $75,360 in revenue and profit around $7,500. Growth is possible.
But if ROAS drops to 2.5x due to market saturation, you'd generate $56,250 in revenue and only profit about $1,750. That same budget increase becomes unprofitable. This is why tracking blended ROAS is critical—it tells you the actual ceiling of your profitable growth.
The Blended ROAS Trap:
Here's what most people get wrong: they add up platform-reported revenue.
- Google Ads claims: $22,000 revenue, $5,000 spend = 4.4x ROAS
- Meta Ads claims: $20,000 revenue, $8,000 spend = 2.5x ROAS
- TikTok Ads claims: $9,000 revenue, $2,000 spend = 4.5x ROAS
- Sum: $51,000 revenue, $15,000 spend = 3.4x ROAS
But actual Shopify revenue is only $50,240. The platforms have overclaimed by $760, or 1.5%. This seems small, but when you're optimizing budgets based on platform ROAS, that error compounds.
Blended ROAS fixes this by using Shopify as the source of truth. You calculate based on money that actually came in, not money that platforms claim they generated.
Marketing Efficiency Ratio (MER)
ROAS is specific to paid advertising. But your marketing includes more than just ad spend: email tools, SMS marketing, influencer partnerships, content creation, maybe a marketing hire.
Marketing Efficiency Ratio (MER) accounts for everything:
Code block (markdown)MER = Total Revenue / Total Marketing Spend
If your marketing spend is:
- Ad platforms: $15,000
- Email tool (Klaviyo): $300/month = $300
- SMS tool (Attentive): $100/month = $100
- Freelance copywriter: $500
- Influencer program: $1,000
- Total marketing spend: $16,900
Then your MER is: %%%CODE_BLOCK_3%%%
This is slightly lower than your ROAS (3.35x) because you're including other marketing investments. But it's a more complete picture of marketing efficiency. If your MER is below 2x, you're not profitably scaling. If it's above 4x, you might be underspending on marketing.
Why MER matters: As you scale, you often increase non-ad marketing spend (hiring a growth marketer, investing in SEO, building an email list). MER tells you if those investments are paying off. ROAS is just ads in a vacuum.
ROAS Benchmarks by Margin
What constitutes "good" ROAS depends entirely on your profit margins. Here's a quick reference:
| Gross Margin | Break-Even ROAS | Target ROAS | Premium ROAS |
|---|---|---|---|
| 70%+ | 1.4x | 2-3x | 4x+ |
| 50-60% | 2x | 3-4x | 5x+ |
| 30-40% | 2.5-3x | 4-5x | 6x+ |
| 20-30% | 3.5x | 5-6x | 7x+ |
The average ecommerce ROAS hovers around 2.87:1 (287% return). Premium and luxury brands often achieve 6:1 or higher because their margins support efficient ad spend. If you're hitting 3-4x blended ROAS with healthy margins, you're in solid territory.
Customer Lifetime Value and CAC
ROAS tells you about immediate returns, but the CLV:CAC ratio reveals long-term business health.
Customer Lifetime Value (CLV): The total revenue you expect from a customer over their entire relationship with your business. If your average customer orders 3 times over 2 years with an AOV of $85, your CLV is approximately $255.
CLV:CAC Ratio: Divide your CLV by your CAC. A healthy ecommerce business targets a 3:1 ratio—for every dollar spent acquiring a customer, you generate $3 in lifetime value.
| Ratio | Interpretation |
|---|---|
| < 1:1 | Losing money on every customer |
| 1-2:1 | Breaking even or marginally profitable |
| 3:1 | Healthy—sustainable growth territory |
| 5:1+ | Potentially under-investing in acquisition |
Why does this matter for your dashboard? Because a 2x blended ROAS might look weak, but if those customers return 3 times over the next year, your effective ROAS is 6x. Track both metrics together.
Cart Abandonment Context: The average cart abandonment rate in ecommerce runs around 70%. This affects attribution because many "lost" customers return later through different channels. A customer who abandoned after clicking a Google ad might complete the purchase a week later via email—confusing your attribution data.
Attribution Reality Check
Here's the truth about attribution: platforms will always claim more revenue than actually occurred.
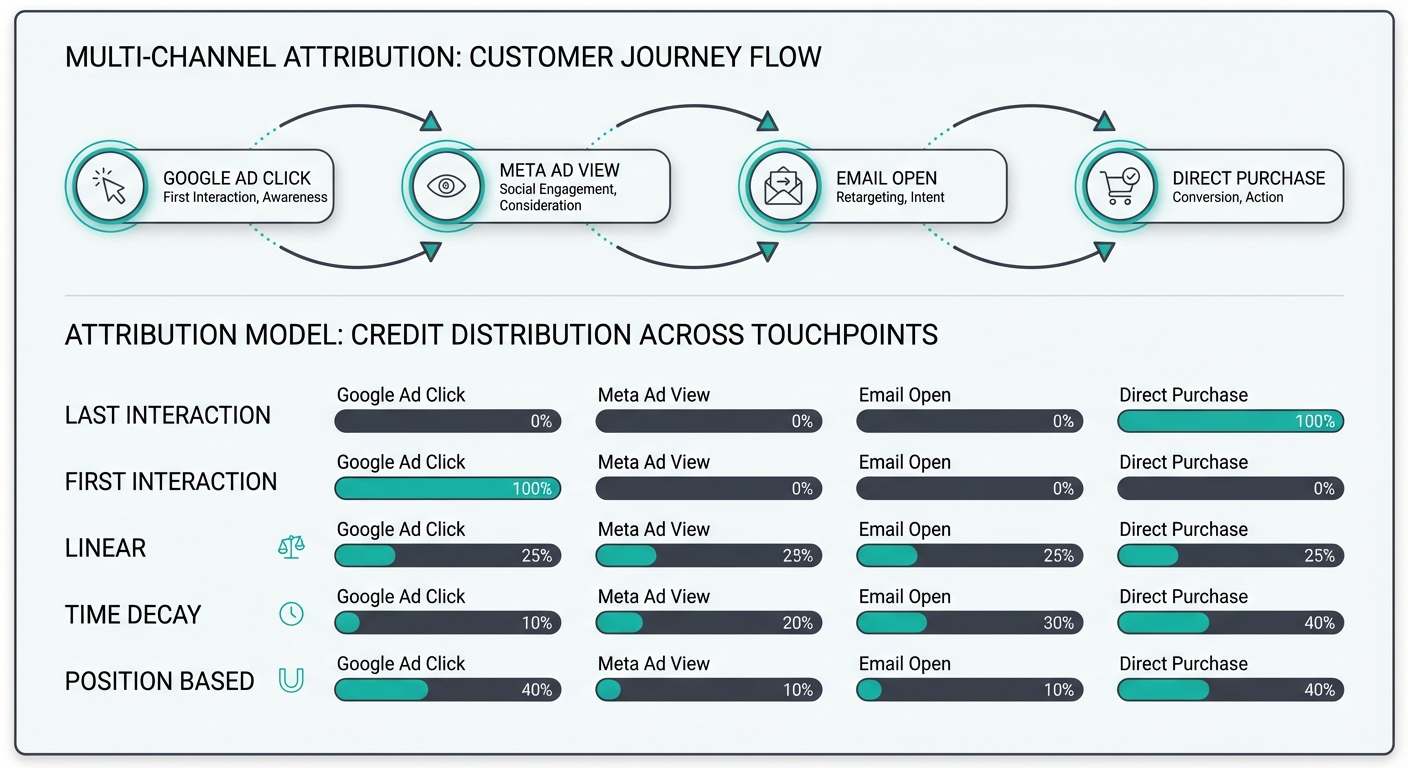 Multi-channel attribution diagram showing customer journey from Google Ad click to Meta Ad view to Email open to Direct purchase, with attribution model credit distribution
This isn't fraud—it's built into how attribution works. If someone:
- Clicks a Google ad (Google gets credit)
- Leaves the site
- Clicks a Meta ad a week later
- Leaves the site
- Types your URL directly and buys
Different attribution models handle this differently:
- Last-click: Meta gets 100% credit (they saw the customer last)
- First-click: Google gets 100% credit (they saw the customer first)
- Linear: Google 50%, Meta 50%
- Time-decay: Google 25%, Meta 75% (more recent clicks get more credit)
Every platform defaults to last-click or first-click, which is why they all overclaim. This is expected and normal.
How to handle it:
-
Accept that platform attribution is imperfect. Stop trying to make platform ROAS data perfectly match Shopify. It won't, and that's okay.
-
Use Shopify as your anchor. Shopify knows the actual revenue. Use that as your ground truth and work backward. If Google claims 40% of attributed revenue and Meta claims 35%, those percentages still give you useful information even if they add up to more than 100%.
-
Use UTM parameters and discount codes for better attribution. When you run a campaign, use unique UTM parameters and discount codes. This gives you explicit attribution even if the platform's pixel data is fuzzy.
-
Run surveys. Ask new customers "How did you hear about us?" when they complete their first purchase. This is imperfect (they might not remember) but useful data.
-
Test and iterate. If you cut Meta's budget in half, see if revenue drops proportionally. If it does, Meta was really driving that revenue. If it doesn't, you were overstating Meta's impact.
Building the Dashboard: Four Essential Sections
A good e-commerce marketing dashboard has four sections. You can build this in Looker Studio, Tableau, or any BI tool, but the structure is the same.
Section 1: Executive Summary
This is the dashboard you check every morning. Four numbers:
-
Total Revenue (Today/This Month/YTD): Pull from Shopify. This is the metric that matters most—it's money in your account.
-
Total Ad Spend (Today/This Month/YTD): Sum of all ad platforms. You need to know what you've spent so far against your budget.
-
Blended ROAS: Revenue / Total Ad Spend. This is the efficiency number. If it drops below your target, you need to investigate why.
-
Month-over-Month Change: Is this month better or worse than last month? Show both revenue change and ROAS change. If revenue is up 20% but ROAS is down 15%, you're spending more to get that growth—which might be the right call, or might not.
Include a simple alert: "ROAS is below target" (with red highlighting) if your blended ROAS falls below your minimum threshold.
Section 2: Channel Performance
Build a table showing each ad platform:
| Platform | Spend | Platform ROAS | % of Spend | YTD Trend |
|---|---|---|---|---|
| Google Ads | $5,000 | 4.4x | 33% | ↑ 8% |
| Meta Ads | $8,000 | 2.5x | 53% | ↓ 5% |
| TikTok Ads | $2,000 | 4.5x | 13% | ↑ 22% |
Next to this, put a bar chart comparing spend and platform ROAS across channels. Visually, this shows you which platforms consume most of your budget and which are most efficient.
Add a trend chart showing how each platform's ROAS has changed over the last 30 days. If Google's ROAS is dropping, you might need to refresh creative or expand your audience. If it's stable, you might be able to increase spend.
Section 3: Product Insights
Show two tables:
Top Products by Revenue:
| Product | Revenue | Profit | Units Sold | AOV Impact |
|---|---|---|---|---|
| Best Seller #1 | $8,500 | $2,550 | 320 | High |
| Best Seller #2 | $6,200 | $1,240 | 410 | Medium |
Top Products by Margin:
| Product | Revenue | Profit Margin | Units Sold | CAC |
|---|---|---|---|---|
| High Margin #1 | $3,200 | 65% | 80 | $32 |
| High Margin #2 | $2,900 | 58% | 75 | $38 |
These two tables might not have the same products. Your highest revenue generator might be lower margin (it makes more absolute profit, but the margin %). Your highest margin product might be a niche item that doesn't scale. Both insights are useful.
Section 4: Customer Metrics
Show:
- New vs. Returning: Pie chart showing percentage of revenue from new customers vs. repeat. Trend line showing if this ratio is getting better or worse.
- Customer Acquisition Cost: Total ad spend / new customers acquired. Track this by month to see if CAC is trending up (more expensive to acquire customers) or down (more efficient targeting).
- Repeat Purchase Rate: % of customers who have purchased more than once. Trend line over time.
- Estimated Customer Lifetime Value: If you have 12+ months of repeat purchase data, calculate this. Divide total revenue from returning customers by the number of unique returning customers. This tells you what each new customer is worth over their lifetime (if they stay for your typical duration).
Automation and Alerts
Once your dashboard is live, set up monitoring so you don't have to manually check it every day.
Daily Revenue Email: Send yourself an automated email every morning with yesterday's revenue. If it's the 15th or 30th of the month, include month-to-date summary. This takes 30 seconds but keeps you aware of trends.
ROAS Drop Alert: If your blended ROAS falls below your minimum (e.g., 2.5x), send an alert immediately. Don't wait until month-end to notice ROAS tanked. By then, you've wasted spend.
Spend Pacing Alert: If your daily spend is running 20% above budget pace, alert you. You're going to blow your monthly budget.
Anomaly Alert: Set up alerts for unusual changes. If revenue drops 30% in a day, or a platform's ROAS suddenly doubles, something changed and needs investigation.
Common E-commerce Dashboard Mistakes
Mistake 1: Using platform revenue instead of Shopify
Never do this. Platform-reported revenue is inflated due to attribution overcounting. Only use Shopify's revenue number.
Mistake 2: Ignoring refunds and chargebacks
If you're not tracking net revenue (after refunds), you're overstating profitability. A 15% refund rate is an early warning sign that customers aren't satisfied.
Mistake 3: Ignoring shipping and discounts
If your Shopify revenue includes shipping but your margin calculation doesn't subtract it, you're overstating profit. Similarly, discounts eat into margin. Net revenue should be (gross sales - refunds - discounts - shipping costs).
Mistake 4: Comparing different attribution windows
If Google is using 30-day attribution and Meta is using 7-day, their ROAS numbers aren't comparable. Make sure all platforms are configured with the same attribution window (typically 30 days for e-commerce).
Mistake 5: Too many metrics
A dashboard with 50 metrics is useless because you can't act on all of them. Focus on 10-15 core metrics:
- Revenue (gross, net)
- Ad spend
- Blended ROAS
- MER
- ROAS by platform
- CAC
- New customer count
- Repeat purchase rate
- Top 5 products
- AOV
Everything else is supporting detail.
Scaling Your Dashboard as You Grow
When you're first building your dashboard, focus on the core metrics above. But as you scale, you can add layers:
0-$100K/month revenue:
- Basic dashboard with revenue, spend, ROAS by channel, top products.
- Weekly check-ins with the data.
$100K-$500K/month revenue:
- Add profit tracking (not just revenue). You need to know if growth is profitable.
- Implement cohort analysis. Are customers acquired in January more valuable than customers acquired in February?
- Product performance by channel. Which channel drives your highest-margin products?
- Email list metrics. If you have a Klaviyo/Klaviyo integration, track email revenue.
$500K-$5M/month revenue:
- Inventory integration. Which products are well-stocked vs. understocked? Are you losing revenue due to stockouts?
- Forecasting features. If ROAS continues to decline at the current rate, when will you hit your break-even ROAS?
- Customer cohort valuation. Based on when they were acquired, what's the lifetime value of customers from each cohort?
- Competitive benchmarking. How does your ROAS, AOV, and CAC compare to industry benchmarks?
FAQ
"My Shopify revenue is $50K, but when I add up all my platform-attributed revenue, I get $51K. Why?"
Attribution overcounting. Platforms assign multiple credits to the same order. Use Shopify's number ($50K) as ground truth for calculating blended ROAS.
"How do I combine multi-platform data if each platform has a different API?"
Use a data integration tool like Supermetrics, Zapier, or a dedicated BI platform. These tools normalize data from different sources into a consistent format. If you're building custom, create a standardized schema (columns for platform, date, spend, clicks, conversions) and map each platform's API to it.
"What's a good blended ROAS for e-commerce?"
It depends on your margins:
- 50% margin: Need at least 2x ROAS to break even
- 40% margin: Need at least 2.5x ROAS to break even
- 30% margin: Need at least 3.33x ROAS to break even
A healthy target is 3-4x ROAS, which gives you room for profit and growth investment.
"Should I use Google Analytics or Shopify for revenue?"
Use Shopify. Google Analytics attribution is even less reliable than platform attribution, and GA doesn't know about refunds. Shopify is the single source of truth.
"I'm getting different numbers from my dashboard and Shopify's native reports. Which is correct?"
Shopify's native reports (which show Shopify orders and revenue) are correct. If your dashboard differs, you have a data sync issue. Check if:
- Ad platform data is delayed (usually 24-48 hour lag)
- Date filtering is consistent (both using same timezone, same date ranges)
- Refunds are properly excluded from revenue calculation
Next Steps
-
Download the free template and make a copy in your Google Drive.
-
Connect your data sources: Follow the setup guide to authenticate Shopify and each ad platform.
-
Verify the numbers: Once data is flowing, check that your dashboard revenue matches Shopify's revenue within 5%. If not, investigate the discrepancy.
-
Set up alerts: Configure email alerts for ROAS drops and daily revenue summaries.
-
Review weekly: Every Monday morning, spend 15 minutes checking your dashboard. Look for trends and anomalies.
-
Make decisions based on data: If one platform is more efficient, shift budget there. If a product isn't converting, optimize or remove it. If ROAS is trending down, investigate whether it's due to market saturation, competitive pressure, or declining customer quality.
Building a dashboard isn't just about reporting—it's about creating a feedback loop. You spend money → you measure results → you optimize based on data → you spend more effectively. Every e-commerce store needs this loop. Without it, you're flying blind.
Related Posts

How to Connect Shopify to Google Sheets (E-commerce Data)
Automatically sync your Shopify store data to Google Sheets. Track orders, products, customers, and marketing performance.

How to Build a Marketing Dashboard in Looker Studio (2026)
Complete guide to building a marketing dashboard in Looker Studio. Connect multiple data sources and create professional reports.

What's a Good ROAS? Benchmarks by Industry and Ad Spend
ROAS benchmarks by industry, ad platform, and budget size. Learn what 'good' really means for your business and how to improve it.
Ready to see your marketing data?
Start your free trial today. See your data in 5 minutes.
Start Free Trial