What's a Good ROAS? Benchmarks by Industry and Ad Spend
ROAS benchmarks by industry, ad platform, and budget size. Learn what 'good' really means for your business and how to improve it.
MetricNexus Team

"What's a good ROAS?" is the most common question in digital advertising. Marketing managers ask it. Business owners lose sleep over it. The answer matters because ROAS determines whether your advertising pays for itself.
But here's the truth: there's no universal "good" ROAS. A 3x return is incredible for one business and a failure for another. What matters is your break-even ROAS—the minimum you need to survive. Everything above that is profit.
This guide covers ROAS benchmarks across industries and platforms, how to calculate your break-even point, and why those benchmarks might be misleading.
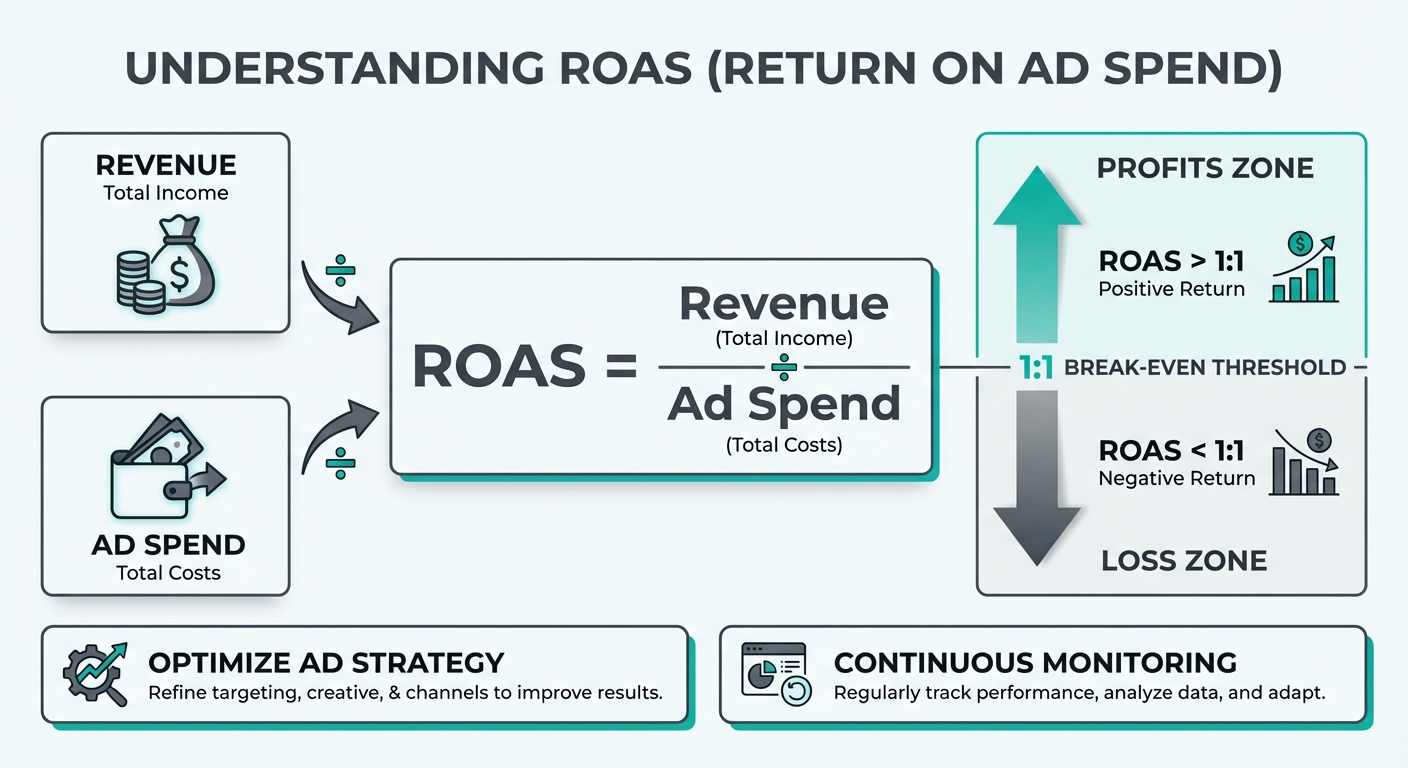 ROAS formula and break-even analysis flow
ROAS Explained (Quick Refresher)
ROAS stands for Return on Ad Spend. It's calculated simply:
ROAS = Revenue Generated ÷ Ad Spend
If you spend $1,000 on ads and generate $4,000 in revenue, your ROAS is 4:1 (or 4x). Every dollar spent produced four dollars in return.
This is different from ROI (Return on Investment), which accounts for all costs, not just ad spend. A 4x ROAS might actually be break-even after accounting for product costs, operations, and other expenses.
What's a "Good" ROAS? (The Real Answer)
You'll see marketing agencies claim that "4x ROAS is the industry standard for good performance." This is oversimplified marketing advice.
The honest answer: a good ROAS is whatever exceeds your break-even point and aligns with your growth targets.
For a high-margin SaaS business (70% gross margin), a 2x ROAS is profitable and good. For a low-margin electronics retailer (15% gross margin), you might need 7-8x ROAS to make money.
That said, there are useful general benchmarks:
- 2-3x ROAS: Profitable for most businesses, but not exciting growth
- 3-5x ROAS: Good performance—this is healthy, sustainable advertising
- 5-10x ROAS: Excellent—you've found product-market fit and scaling efficiency
- 10x+ ROAS: Exceptional—typically only possible with brand awareness, high-intent audiences, or strong customer lifetime value
Keep reading to find your specific benchmark by industry and platform.
ROAS Benchmarks by Industry
ROAS varies dramatically across industries due to differences in margins, customer lifetime value, and competition.
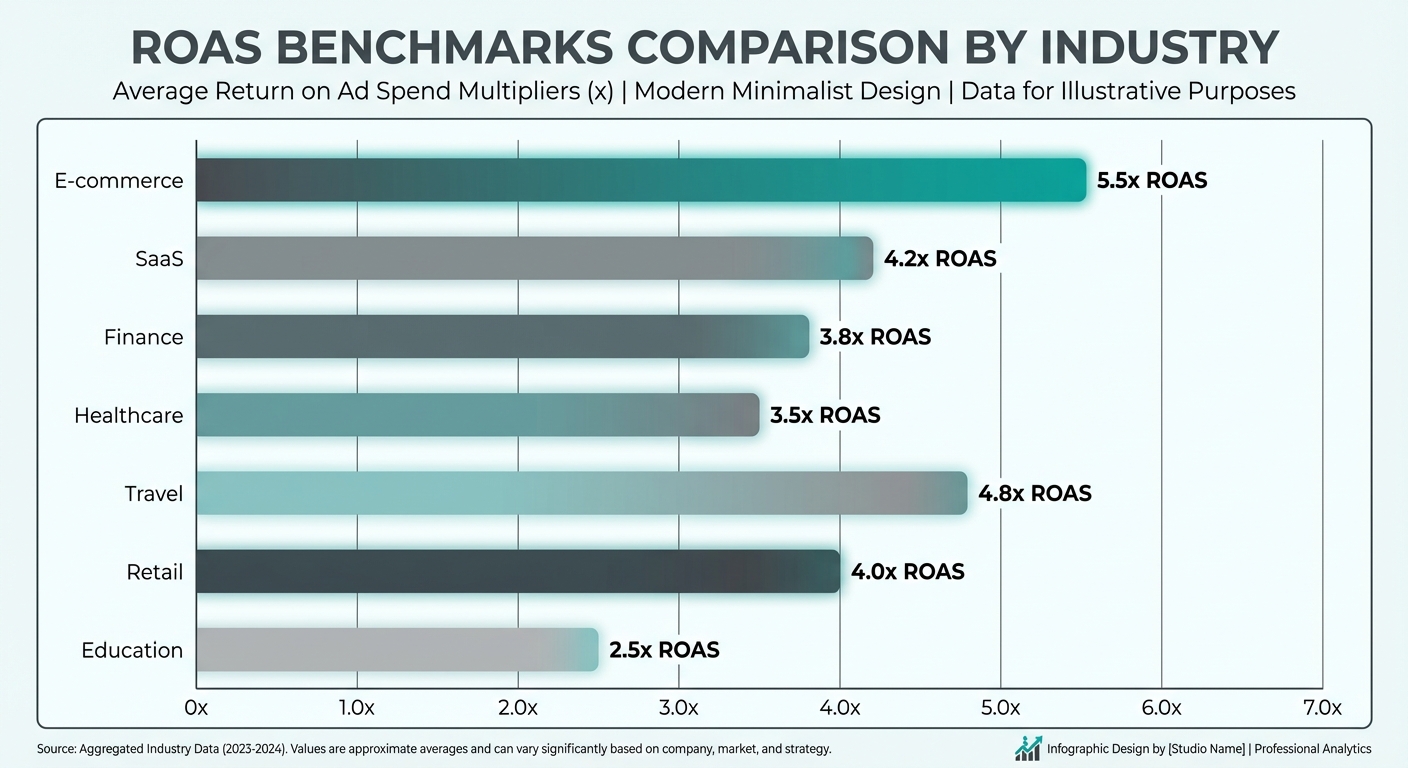 ROAS benchmarks by industry comparison
E-commerce
E-commerce is highly competitive, and margins are often thin. Here's what healthy ROAS looks like by category:
| Category | Below Average | Average | Good | Excellent |
|---|---|---|---|---|
| Apparel & Fashion | <2x | 2-3.5x | 4-6x | >6x |
| Electronics | <1.5x | 1.5-2.5x | 3-4.5x | >5x |
| Beauty & Skincare | <2.5x | 3-4.5x | 5-8x | >8x |
| Home & Garden | <1.5x | 2-3.5x | 4-6x | >6x |
| Food & Beverages | <1.5x | 2-3x | 3.5-5x | >5x |
Beauty products command higher ROAS because of strong brand loyalty and repeat purchases. Electronics are tougher because margins are razor-thin and customers often research extensively before buying.
SaaS and Software
SaaS companies should measure ROAS differently than e-commerce. Your first-purchase ROAS might be 2-3x, but your true ROAS multiplies when you include customer lifetime value.
- First-purchase ROAS: 1.5-3x (before LTV)
- LTV-adjusted ROAS: 5-15x (including future revenue)
A SaaS company breaking even or losing money on initial acquisition is normal and healthy—you make profit over months or years as the customer uses the service.
Lead Generation Services
Lead generation ROAS is tricky because it depends entirely on the value of each lead. A real estate agent might spend $100 acquiring a lead worth $3,000 in commission (30x ROAS). A home services company might spend $50 per lead worth $500 (10x ROAS).
Instead of ROAS, lead gen companies often use Cost Per Lead (CPL) and Cost Per Qualified Lead (CPQL) as primary metrics.
When you do measure lead gen ROAS, aim for 5-10x at minimum.
Local Services (Plumbing, HVAC, Legal, etc.)
Local services typically see 3-5x ROAS with proper targeting. Higher-value services (legal, accounting) can achieve 8-15x ROAS because the customer value is substantial.
ROAS Benchmarks by Ad Platform
Different platforms attract different audience intent levels. Search ads typically outperform display ads because they capture people actively looking for solutions.
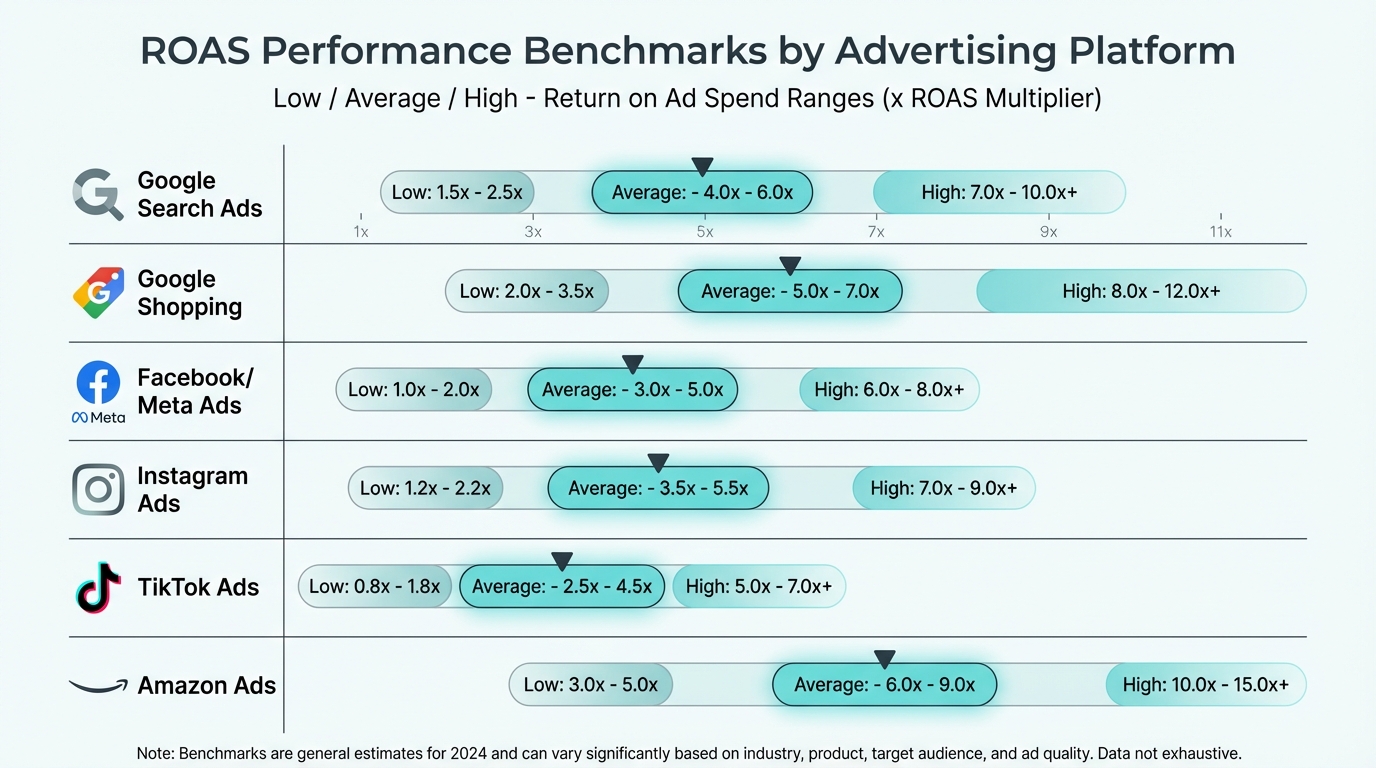 ROAS performance benchmark by platform
Google Ads ROAS
Google dominates search, and search dominates ROAS performance:
| Campaign Type | Average ROAS | Why |
|---|---|---|
| Search - Brand Keywords | 8-20x | High intent, branded searches, repeat visitors |
| Search - Non-Brand Keywords | 2-5x | Still high intent, but more competitive bidding |
| Shopping Ads | 4-8x | Visual product ads, high purchase intent |
| Display Network | 0.5-2x | Low intent awareness ads, many impressions wasted |
| YouTube | 1-3x | Video ads, brand building, lower conversion intent |
The gap between search (8-20x for brand) and display (0.5-2x) is enormous. This is why search gets the budget in most accounts.
Meta Ads (Facebook & Instagram) ROAS
Meta's reach is massive, but iOS 14 privacy changes made tracking less reliable. Their reported ROAS is often inflated because of attribution errors.
| Campaign Type | Average ROAS | Reality Check |
|---|---|---|
| Prospecting (New Audience) | 1.5-3x | Challenging, wide targeting, many waste impressions |
| Retargeting (Website Visitors) | 5-12x | Much higher intent, repeat exposure effect |
| Custom Audiences | 3-8x | Targeted to past customers or lookalikes |
| Overall Average | 2-4x | If you achieve this consistently, you're doing well |
Meta campaigns underperform Google Search primarily because audience intent is lower. You're interrupting people scrolling through their feed, not capturing people searching for your solution.
TikTok Ads ROAS
TikTok is younger and still building advertising maturity. Benchmarks are less stable:
- Average ROAS: 1.5-3x
- Best-performing verticals: Beauty, fashion, food, gaming
- Advantage: Highly creative content performs well; excellent for younger demographics
- Challenge: Lower purchase intent, attribution reliability is still improving
If you're selling to Gen Z and Gen Alpha, TikTok can punch above its weight. If you're selling to older audiences, you'll see lower ROAS.
Amazon Ads ROAS
Amazon Ads target high-intent shoppers actively looking for products:
| Ad Type | Average ROAS | Notes |
|---|---|---|
| Sponsored Products | 3-5x | Search results, highest intent, most competition |
| Sponsored Brands | 2-4x | Brand awareness and visibility |
| Sponsored Display | 1-3x | Retargeting, lower ROAS |
Amazon seller ROAS is typically higher than general e-commerce because the audience is already on a shopping platform.
LinkedIn Ads ROAS
LinkedIn targets professionals and works best for B2B:
- Average ROAS: 2-5x depending on conversion tracking accuracy
- Best for: Lead generation, software, B2B services
- Challenge: Higher cost per click, but qualified audience
Pinterest Ads ROAS
Pinterest users are in discovery and planning mode, especially for home, fashion, and lifestyle:
- Average ROAS: 1.5-4x
- Sweet spot: Home renovation, fashion, DIY, wedding planning
- Profile: High-income female audience, strong purchase intent
ROAS by Ad Spend Level
Your ad budget size affects what ROAS is achievable. There's a "sweet spot" where you have enough volume to optimize, but haven't hit diminishing returns.
Low Spend ($0-5K/month)
At this budget level, your main challenge is statistical significance. With small spend, daily variance is high:
- Typical ROAS: 1.5-4x (high variance)
- Challenge: Not enough conversions per day to identify what's working
- Reality: You might see 10x one day and 0x the next
- Implication: Don't obsess over daily ROAS; measure weekly or monthly
At low spend, focus on eliminating waste (bad audiences, poor creative) rather than squeezing incremental gains.
Medium Spend ($5K-20K/month)
This is the optimization sweet spot:
- Typical ROAS: 3-6x (more stable)
- Advantage: Enough daily conversions to test variations
- Testing: You can run 3-4 audience or creative variants simultaneously
- Timescale: Results stabilize after 1-2 weeks of testing
Most growing businesses operate in this range. You have enough data to be confident in optimization, but not so much that all channels are saturated.
High Spend ($20K+/month)
Higher spend brings economies of scale but also diminishing returns:
- Typical ROAS: 4-8x (very stable, mature)
- Advantage: Massive testing capability, sophisticated attribution
- Challenge: Limited scaling—all good audiences are bid-saturated
- Strategy: Focus on retention, customer lifetime value, and brand building
At high spend, you're often constrained by audience size, not your ability to optimize. Your main opportunity is expanding to new channels.
How to Calculate Your Break-Even ROAS
This is the most important number in your advertising. Your break-even ROAS is the minimum ROAS you need to make money.
Formula: Break-Even ROAS = 1 ÷ Gross Margin %
Your gross margin is revenue minus the direct cost of goods sold (or service delivery). It doesn't include operating expenses.
Examples:
Example 1: Apparel Retailer
- Retail price: $50
- Cost of goods: $20
- Gross margin: $30 ÷ $50 = 60%
- Break-even ROAS: 1 ÷ 0.60 = 1.67x
- Healthy ROAS target: 3-4x (2x profit on each advertising dollar)
Example 2: SaaS (Monthly Subscription)
- Monthly revenue per customer: $99
- Cost to deliver service: $20/month
- Customer lifetime (assume 24 months): $99 × 24 = $2,376 LTV
- If customer acquired for $200 ad spend: ROAS = $2,376 ÷ $200 = 11.8x
Example 3: Electronics Retailer
- Product price: $200
- Cost of goods: $140
- Gross margin: $60 ÷ $200 = 30%
- Break-even ROAS: 1 ÷ 0.30 = 3.33x
- Healthy ROAS target: 5-7x (to account for operating costs)
Once you know your break-even ROAS, any ROAS above that number is profit. Your goal isn't just to hit break-even—it's to run profitably while growing.
Why ROAS Varies So Much
If you're comparing your ROAS to industry benchmarks and they don't match, here's why:
Profit Margins: A 70% margin beauty brand can afford to spend more per customer than a 15% margin electronics retailer. Lower margins require higher ROAS.
Average Order Value (AOV): Businesses with higher AOV can afford higher customer acquisition costs and will naturally show higher ROAS because the denominator (ad spend) is smaller relative to revenue.
Customer Lifetime Value (LTV): Subscription and membership businesses should measure ROAS including LTV. First-purchase ROAS looks terrible until you factor in repeat revenue.
Competition Level: Mature, competitive categories (fitness, skincare, dating apps) have driven up customer acquisition costs, lowering ROAS. Niche categories with less competition show higher ROAS.
Seasonality: Q4 ROAS is typically 2-3x higher than Q1 due to holiday shopping. Seasonal fluctuations are normal.
Attribution Model: Last-click attribution credit gives all revenue to the last touchpoint. Multi-touch attribution spreads credit across channels. Different models produce different ROAS numbers for the same business.
Measurement Window: A 7-day measurement window misses conversions that happen on day 8-14. A 30-day window captures more, but inflates ROAS. Always document your window.
Market Saturation: As you spend more in a platform, you exhaust high-intent audiences first and move to progressively lower-intent groups. Higher spend naturally produces lower ROAS.
Seasonal ROAS Patterns
ROAS isn't static throughout the year. Understanding seasonal patterns helps you set realistic expectations and allocate budget strategically.
Peak Season (November-December)
- ROAS typically 2-3x higher than annual average
- E-commerce sees 3.5-5x ROAS during Black Friday/Cyber Monday
- Higher purchase intent + holiday urgency = better conversion rates
- Competition increases, but so does buyer motivation
Slow Season (January-February)
- ROAS drops to 1.8-2.2x for most industries
- Post-holiday fatigue reduces purchase intent
- Good time for brand-building campaigns (lower CPMs)
- Focus on customer retention over acquisition
Spring/Summer (March-August)
- ROAS stabilizes to normal benchmarks
- Category-dependent peaks (travel in summer, fitness in January)
- Best time for testing new audiences and creatives
Strategic Implications
- Don't panic if January ROAS is half your November performance
- Shift budget toward retargeting during slow seasons
- Use slow periods to build email lists for Q4 campaigns
- Compare year-over-year, not month-over-month
The Problem with Platform-Reported ROAS
Here's a uncomfortable truth: the ROAS that Facebook, Google, or TikTok report is likely higher than your actual ROAS.
Why Platforms Over-Report ROAS
Attribution Overlap: Both Facebook and Google might claim credit for the same conversion. A customer clicks your Facebook ad (impression 1), then later Googles your brand and clicks a search ad (impression 2), then converts. Facebook reports it as a conversion. Google also reports it as a conversion. Your actual revenue is 1x, but the platforms combined are reporting 2x ROAS.
Assisted Conversions: A customer views a display ad (doesn't click), later clicks your search ad and converts. Google Search reports the conversion as 1x revenue, but the display ad gets "assisted conversion" credit in the reporting interface.
iOS 14+ Attribution Issues: Apple's privacy changes broke Facebook's tracking. Studies show Meta's reported conversions are inflated by 20-30% due to attribution loss. Their conversion reporting has become less reliable, and they've shifted to aggregated, modeled numbers that often over-report conversions.
View-Through Conversions: Platforms credit purchases to ads the customer saw but didn't click. This inflates ROAS because conversion causation is harder to prove with impressions than clicks.
What to Do Instead
- Use your own data: Track conversions in your system (Google Analytics 4, custom database), not relying solely on platform reporting
- Cross-reference platforms: If Facebook reports $10K in conversions and Google reports $12K from the same period, your actual revenue was likely $10-11K, not $22K
- Measure incrementally: Run a test group and a control group. The difference in conversion rates between groups is your true ROAS
- Watch for seasonal patterns: Platform tracking tends to get worse during holiday season (more traffic, attribution chaos)
Bottom line: Take platform-reported ROAS as a directional signal, not absolute truth. Compare month-to-month trends within a platform rather than trusting the absolute numbers.
ROAS vs. ROI: What's the Difference?
These terms are often confused, but they measure different things.
ROAS (Return on Ad Spend):
- Formula: Revenue ÷ Ad Spend
- Ignores all costs except advertising
- Shows the gross return on your advertising investment
- Example: 4x ROAS = $4 revenue per $1 ad spend
ROI (Return on Investment):
- Formula: (Profit - Cost) ÷ Cost
- Accounts for all costs: COGS, fulfillment, operations, salaries
- Shows true profitability
- Example: 100% ROI = $1 profit per $1 invested
Why This Matters
A business might report "4x ROAS" while actually breaking even or losing money. Here's a realistic example:
- Ad spend: $1,000
- Revenue generated: $4,000 (4x ROAS)
- Cost of goods: $2,000 (50% of revenue)
- Gross profit: $2,000
- Operating costs (fulfillment, customer service, etc.): $1,500
- Net profit: $500
- ROI: 50%
The 4x ROAS looks amazing. The actual profit (50% ROI) is modest.
For SaaS, the math is different because there's minimal COGS:
- Ad spend: $500
- Revenue generated: $1,500 (3x ROAS)
- COGS: $300
- Gross profit: $1,200
- Operating costs (allocated): $400
- Net profit: $800
- ROI: 160%
Same ROAS (technically), dramatically different profitability.
Calculate both and understand which number matters for your business. For growth-focused companies, sometimes ROI matters less than growth rate. For profitability-focused companies, ROI is everything.
How to Improve Your ROAS
ROAS improves when you either increase revenue or decrease ad spend (or both). Here are the main levers:
1. Improve Targeting Narrow your audience to higher-intent segments. Test geographic, demographic, and behavioral targeting. Remove unprofitable audiences. Even a 10% improvement in targeting efficiency can improve ROAS 20-30%.
2. Optimize Landing Pages Your ads are only as good as where they lead. A 1% improvement in conversion rate can improve ROAS 5-10%. Test different headlines, product photos, checkout flows, and value propositions.
3. Increase Average Order Value Sell more per customer: bundles, upsells, premium versions. Increasing AOV by 20% improves ROAS 20% (assuming same conversion rate).
4. Improve Creative Quality Better ads get higher click-through rates and attract higher-intent audiences. Test variations: different images, video vs. static, lifestyle vs. product shots.
5. Reduce Cost Per Click Improve your quality score (Google), relevance score (Meta), or engagement (TikTok). Higher-quality ads have lower costs for same traffic.
6. Focus on High-Intent Audiences Retargeting (5-10x ROAS) outperforms prospecting (1-3x ROAS) dramatically. If you're doing 70% prospecting and 30% retargeting, flip it.
A proven budget allocation framework:
- 40-50% Cold audiences: Brand awareness and new customer acquisition
- 30-40% Warm audiences: Engaged visitors, email subscribers, social followers
- 20-30% Hot audiences: Cart abandoners, past purchasers, high-intent retargeting
This allocation balances growth (cold) with efficiency (hot). Retargeting campaigns deliver 71% higher ROAS than prospecting campaigns, so maximizing your warm and hot audiences first makes sense.
7. Leverage Customer Lifetime Value If customers repeat purchase, structure your acquisition budget around LTV, not first-purchase profit. This lets you afford higher acquisition costs and acquire more customers.
8. Test New Channels If one channel is saturated, try a new one. The earliest adopters in a new channel often see exceptional ROAS before competition drives costs up.
When ROAS Isn't the Right Metric
ROAS isn't always the primary metric to optimize. Consider alternatives in these situations:
Brand Awareness Campaigns: You're not trying to sell immediately; you're building recognition. Measure impressions, reach, frequency, and brand lift studies instead. ROAS will be 0-1x because you're not capturing conversions yet.
New Customer Acquisition: For high-LTV businesses, first-purchase ROAS might look terrible (0.5-2x) until you include repeat revenue. Track customer lifetime value and retention rate instead.
Margin-Varying Catalog: Retail companies selling multiple products at different margins might see inflated ROAS because high-margin items are overweighted. Track gross profit instead of revenue.
Seasonal Campaigns: Holiday season ROAS is 3-5x higher than January ROAS. Comparing across seasons is misleading; compare year-over-year instead.
Market Testing: Early-stage companies spending to enter a new market shouldn't expect healthy ROAS yet. Track customer acquisition and retention curve instead.
Better metrics for these scenarios: Cost Per Acquisition (CPA), Profit Per Customer, Customer Retention Rate, Lifetime Value, or brand tracking studies.
FAQ: Common ROAS Questions
Q: Is 3x ROAS good? A: It depends on your business. For a 50% margin e-commerce business, 3x ROAS is healthy. For a 30% margin business, it's break-even or losing money. Calculate your break-even ROAS first.
Q: What's the average ROAS across all industries? A: The 2026 average is roughly 2.19x for Meta ads and 4x for Google Ads across all industries combined. But averages hide the real story. Your benchmark should be your industry, platform, and business model.
Q: Can you achieve 10x ROAS? A: Yes, but it's usually specific to certain segments: branded search, high-LTV products, retargeting to warm audiences, or high-margin niche products. As you scale, ROAS naturally decreases.
Q: Why is my ROAS lower than benchmarks? A: Common reasons: (1) poor targeting, (2) weak creative, (3) high-friction landing page, (4) different attribution model, (5) measuring over too short a period, (6) different industry definition.
Q: How often should I check ROAS? A: Don't obsess daily. Check weekly for directional trends, monthly for strategic decisions. Volatility is normal, especially with low spend.
Q: Is platform-reported ROAS accurate? A: It's usually overstated by 10-50% due to attribution issues. Use it to track trends within a platform, not as absolute truth.
ROAS Benchmark Quick Reference
Here's a summary table for quick lookup:
| Industry | Platform | Average ROAS | Good ROAS | Notes |
|---|---|---|---|---|
| E-commerce (Apparel) | Google Search | 3-4x | 4-6x | High competition |
| E-commerce (Beauty) | Meta (Facebook) | 2.5-3.5x | 4-6x | Creative matters more |
| Electronics | Google Shopping | 2-3x | 3-4x | Low margins compress ROAS |
| SaaS (First Purchase) | Google Search | 1.5-2x | 2-3x | LTV adjusts upward |
| SaaS (LTV-Based) | Google Search | 5-15x | 8-12x | Includes subscription value |
| Lead Gen (High Value) | Google Search | 5-10x | 8-15x | Depends on lead value |
| Local Services | Google Local Services | 4-6x | 6-10x | Geographic focus helps |
| D2C (New Brand) | Meta + Google | 2-4x | 3.5-5x | Scales with brand awareness |
Track Your ROAS Over Time
The most important thing you can do is establish a baseline and track it.
Set up monthly tracking:
- Calculate your current ROAS for each platform
- Document your gross margin and break-even ROAS
- Set a realistic growth target (5-10% improvement month-over-month)
- Test one major change per month (targeting, creative, channel, landing page)
- Measure the impact
Don't obsess over hitting a specific ROAS number in any given month. Focus on the trend. If your ROAS is improving consistently and you're above break-even, you're winning.
Real businesses don't have flat ROAS. It moves with seasons, competition, product changes, and market conditions. Your job is to keep it trending up while remaining profitable.
Want to track your ROAS automatically and compare against real benchmarks for your industry? MetricNexus gives you a complete picture of your marketing performance across all platforms, with peer benchmarks and AI-powered recommendations. No spreadsheets, no guesswork.
Related Posts

SMB Marketing Benchmarks 2026: What 'Good' Actually Looks Like
Marketing benchmarks specifically for small businesses. Real data on ROAS, CAC, conversion rates, and more - not enterprise metrics.
Marketing Attribution Explained (Finally, in Plain English)
Marketing attribution doesn't have to be complicated. Here's what it means, why it matters, and how to actually use it - without a PhD in statistics.

The Complete Guide to Marketing Data (For Non-Technical Teams)
Everything you need to know about marketing data - without the jargon. A practical guide for marketers who aren't data engineers.
Ready to see your marketing data?
Start your free trial today. See your data in 5 minutes.
Start Free Trial