How to Build a Marketing Dashboard in Looker Studio (2026)
Complete guide to building a marketing dashboard in Looker Studio. Connect multiple data sources and create professional reports.
MetricNexus Team

Looker Studio (formerly Google Data Studio) is free and connects to most marketing data sources. In this comprehensive guide, we'll walk you through building a professional marketing dashboard that gives you real-time visibility into your campaigns, channels, and ROI—without paying a penny.
What You'll Build
By the end of this tutorial, you'll have a professional marketing dashboard that displays:
- Overview scorecards showing total spend, conversions, ROAS, and cost per conversion at a glance
- Trend charts visualizing performance over time with daily or weekly granularity
- Channel breakdown comparing performance across Google Ads, Meta, TikTok, and other platforms
- Campaign performance table with sortable, filterable data for detailed analysis
- Interactive filters allowing viewers to slice data by date range, campaign, or channel
- Mobile-responsive design that works on phones, tablets, and desktops
The dashboard will be fully interactive, shareable, and updatable in real-time as your data sources refresh.
[Screenshot: A professional Looker Studio dashboard showing KPI cards, trend chart, and channel comparison]
Prerequisites
Before you start, make sure you have:
- A Google account (free; required to use Looker Studio)
- Access to your marketing data sources - we'll cover connecting Google Ads, Google Analytics 4, Meta Ads, TikTok Ads, and others
- Approximately 30-45 minutes to build your first dashboard
- Basic familiarity with marketing metrics (spend, conversions, ROI, etc.) - but you don't need to be technical
No coding, SQL, or special software required. Everything runs in your browser.
Quick Concept: Dimensions vs. Metrics
Every chart in Looker Studio uses two building blocks:
- Dimensions describe what you're measuring: Campaign Name, Date, Device Type, Country. They appear as rows, labels, or axis categories.
- Metrics are the numbers you're measuring: Spend, Clicks, Conversions, Revenue. They appear as values, bars, or line heights.
A bar chart showing "Spend by Campaign" uses Campaign Name as the dimension and Spend as the metric. Understanding this distinction makes every step below faster.
Step 1: Plan Your Dashboard Before You Build
The biggest mistake marketers make is jumping straight into building without planning. Spending 10 minutes thinking about your dashboard will save you hours of rework.
Who Is This Dashboard For?
Your dashboard's layout and content should depend on its audience:
- Executive dashboards focus on high-level metrics: total spend, revenue generated, overall ROI, and month-over-month trends
- Marketing manager dashboards dig deeper: channel breakdowns, campaign performance, cost per conversion by source, and budget allocation
- Client reporting dashboards emphasize results: what you delivered, comparing performance to goals, and month-over-month improvements
For this guide, we're building a marketing manager dashboard that's detailed enough to drive strategy but clean enough to share with stakeholders.
What Questions Should Your Dashboard Answer?
Before adding a single chart, write down the questions you want to answer:
- How is marketing performing overall? (Total spend, conversions, revenue, ROAS)
- Which channels drive the most conversions? (Channel breakdown)
- What's our cost per conversion by channel? (Budget efficiency comparison)
- Are we trending up or down? (Week-over-week and month-over-month growth)
- Which campaigns are under-performing? (Campaign-level details)
- Where should we invest more budget? (ROI by channel and campaign)
These questions become your dashboard sections.
What Time Periods Do You Need?
Plan for:
- Daily view for fast-moving campaigns (TikTok, Google Ads)
- Weekly view for overall trend tracking
- Monthly view for budget and goal comparison
- Period comparisons like MTD (month-to-date) vs last month, or YTD (year-to-date) vs last year
We'll build filters to support all of these without creating separate dashboards.
Step 2: Set Up Your Data Sources
Looker Studio shines because it connects to most major platforms natively, plus hundreds of others through third-party connectors. As of 2026, Looker Studio supports over 1,000 partner connectors spanning ad platforms, CRMs, ecommerce tools, and databases.
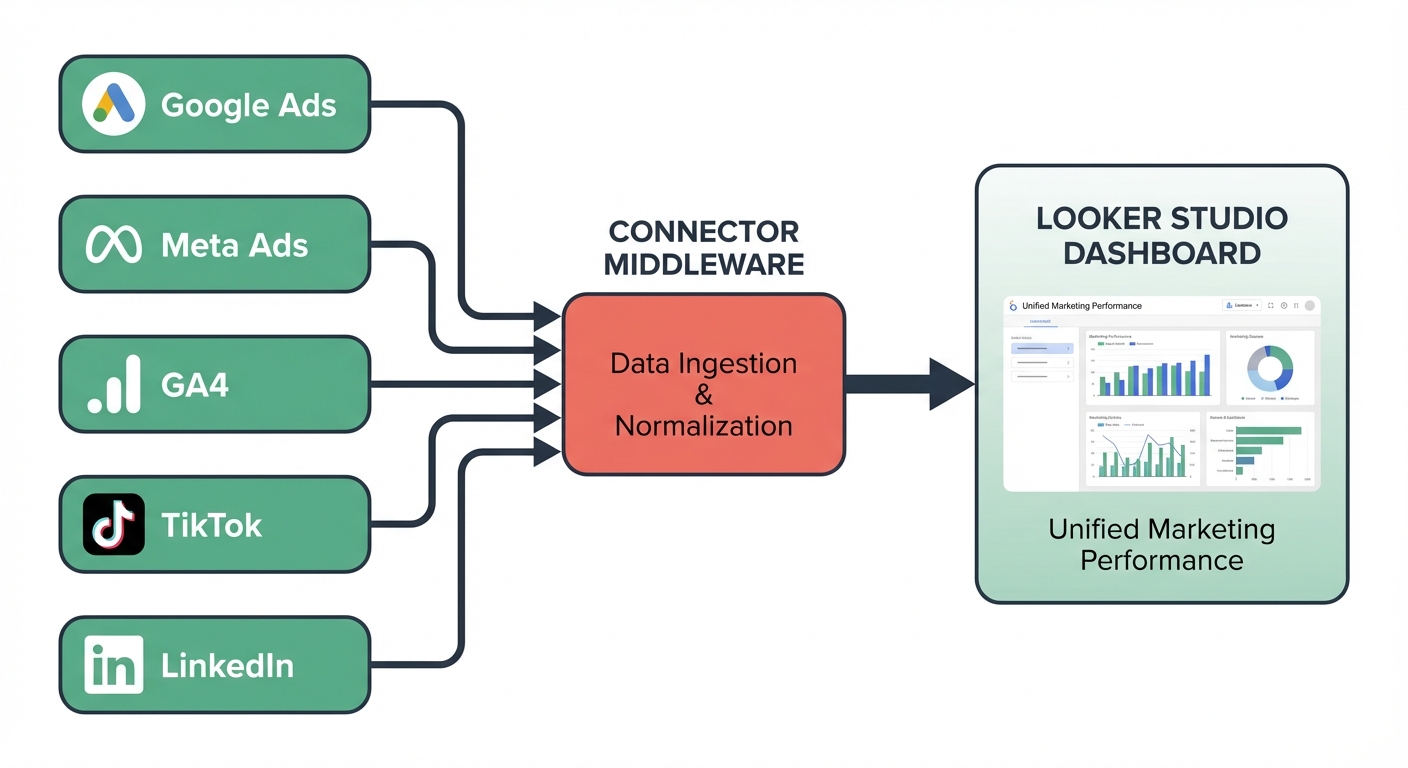 Data sources connecting through connectors to a Looker Studio dashboard
Connecting Google Ads (Native)
Google Ads connects directly to Looker Studio with no setup needed:
- Go to looker.studio and click "Create" → "Report"
- A blank report appears. Click the data icon (table icon) in the toolbar
- Click "Create new data source"
- Scroll down to "Google Ads" and click it
- Authorize your Google account when prompted
- Select your Google Ads account and click "Connect"
- Name the data source "Google Ads" and click "Create report"
You now have access to all standard Google Ads metrics: spend, clicks, impressions, conversions, cost per conversion, conversion value, and more.
[Screenshot: Google Ads connector selection in Looker Studio]
Connecting Google Analytics 4 (GA4)
GA4 also connects natively. Set up is similar:
- In your report, click the data icon again and "Create new data source"
- Select "Google Analytics 4"
- Authorize your account and select the GA4 property you want to connect
- Click "Connect"
With GA4, you'll access events, user counts, conversion data, and custom events. This gives you visitor behavior data that Google Ads alone can't provide.
Pro tip: Connect multiple GA4 properties if you track different sites or conversion types. You can blend data from multiple sources later.
[Screenshot: GA4 connector authorization flow]
Connecting Meta Ads, TikTok, and Other Platforms
Third-party platforms like Meta Ads, TikTok, LinkedIn, Twitter, and others require a connector. Several options exist:
Popular connectors:
- MetricNexus - Direct integration with Looker Studio, supports 20+ ad platforms
- Supermetrics - Industry standard, supports 130+ data sources
- Porter Metrics - 80+ pre-built templates with built-in connectors
- Coupler.io - Simple connector that pulls data into Google Sheets, which Looker Studio can read
- Google Sheets + native APIs - Manual but free option for advanced users
For most users, we recommend MetricNexus because it integrates seamlessly with Looker Studio. Here's the setup:
- Visit metricnexus.com and sign up (free tier available)
- Connect your Meta Ads account, TikTok account, or other platforms
- Configure which metrics to pull (spend, conversions, impressions, etc.)
- In Looker Studio, add MetricNexus as a data source (it appears in the connector list)
- Authorize MetricNexus and select the data set you created
Data refreshes automatically, typically within 6-24 hours depending on the platform.
Cost note: All three platforms have free tiers. MetricNexus starts at $99/month for agencies; Supermetrics at $99/month; Coupler.io at $29/month. Looker Studio itself is always free.
[Screenshot: Adding a third-party connector to Looker Studio]
Step 3: Create Your Dashboard Structure
Now that your data sources are connected, let's plan the layout. A professional marketing dashboard follows this structure:
Recommended Layout
Code block (markdown)┌─────────────────────────────────────────────────┐
│  Logo    Dashboard Title          [Date Range] [Filters] │
├─────────────────────────────────────────────────┤
│ [Spend]  [Conversions]  [ROAS]  [Cost/Conv]   │
│  $15.2K      485      2.4x      $31.44       │
├─────────────────────────────────────────────────┤
│                                                   │
│           Spend & Conversions Trend             │
│      (Line chart with 2 metrics over time)      │
│                                                   │
├─────────────────────────────────────────────────┤
│          Performance by Channel                  │
│   Google Ads | Meta | TikTok | LinkedIn        │
│   (Bar chart or table)                          │
├─────────────────────────────────────────────────┤
│          Campaign Performance                    │
│   Campaign Name  | Spend | Conv | ROAS        │
│   (Detailed data table)                         │
├─────────────────────────────────────────────────┤
│                Last updated: 2 hours ago         │
└─────────────────────────────────────────────────┘
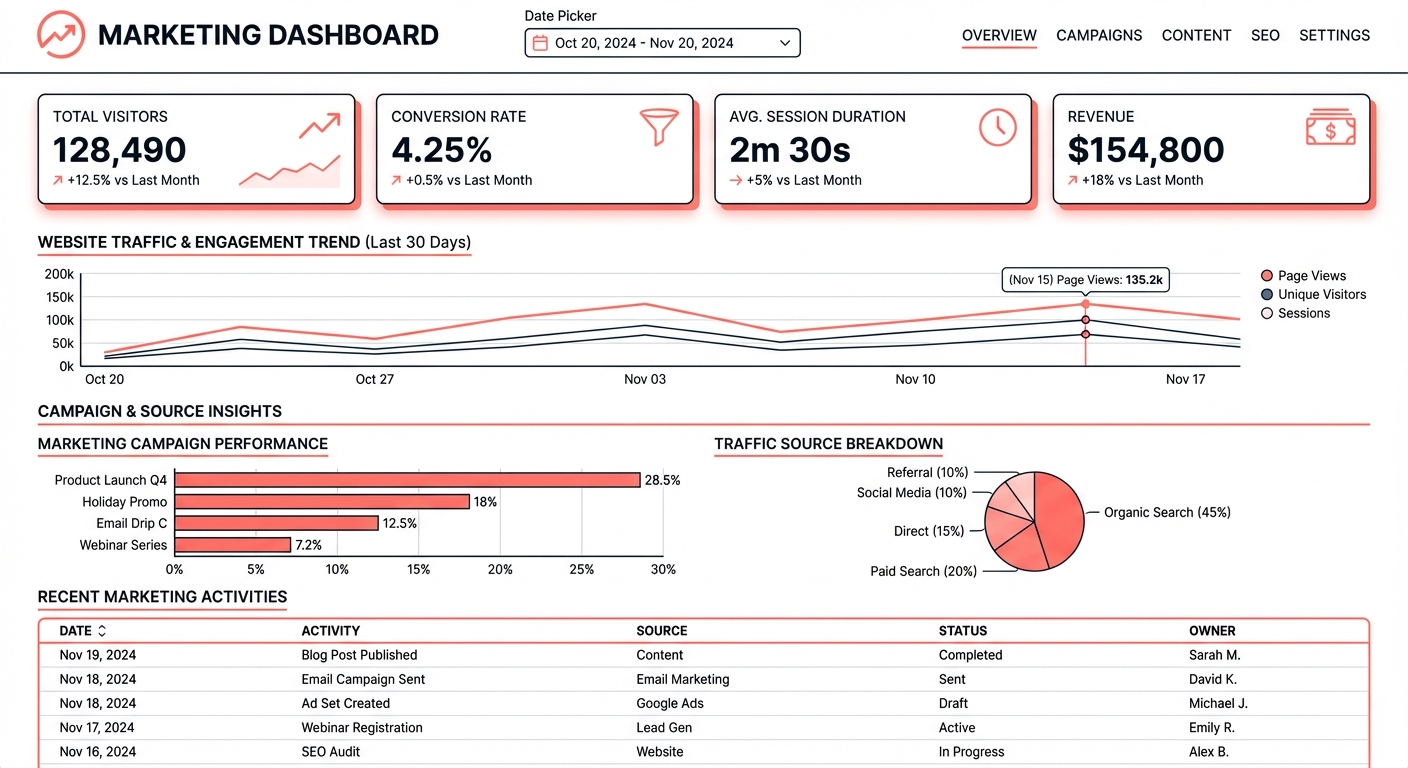 Recommended marketing dashboard layout showing KPI scorecards, trend chart, bar chart, pie chart, and data table
This layout works for both managers and executives:
- Top metrics give you the story in 5 seconds
- Charts show trends and comparisons visually
- Tables provide drill-down detail
- Filters let viewers customize the view
Setting Up the Canvas
- Click into your blank report
- At the top, click "Untitled Report" and name it "Marketing Dashboard 2026"
- In the top-right corner, click the three dots → "Report settings"
- Set the theme to "Light" or "Dark" depending on your preference
- Leave the canvas size at default (it auto-scales to screen sizes)
Now you're ready to add components.
[Screenshot: Report settings and theme options]
Step 4: Build Key Components
Let's build the dashboard from top to bottom. Each component type serves a different purpose in your dashboard.
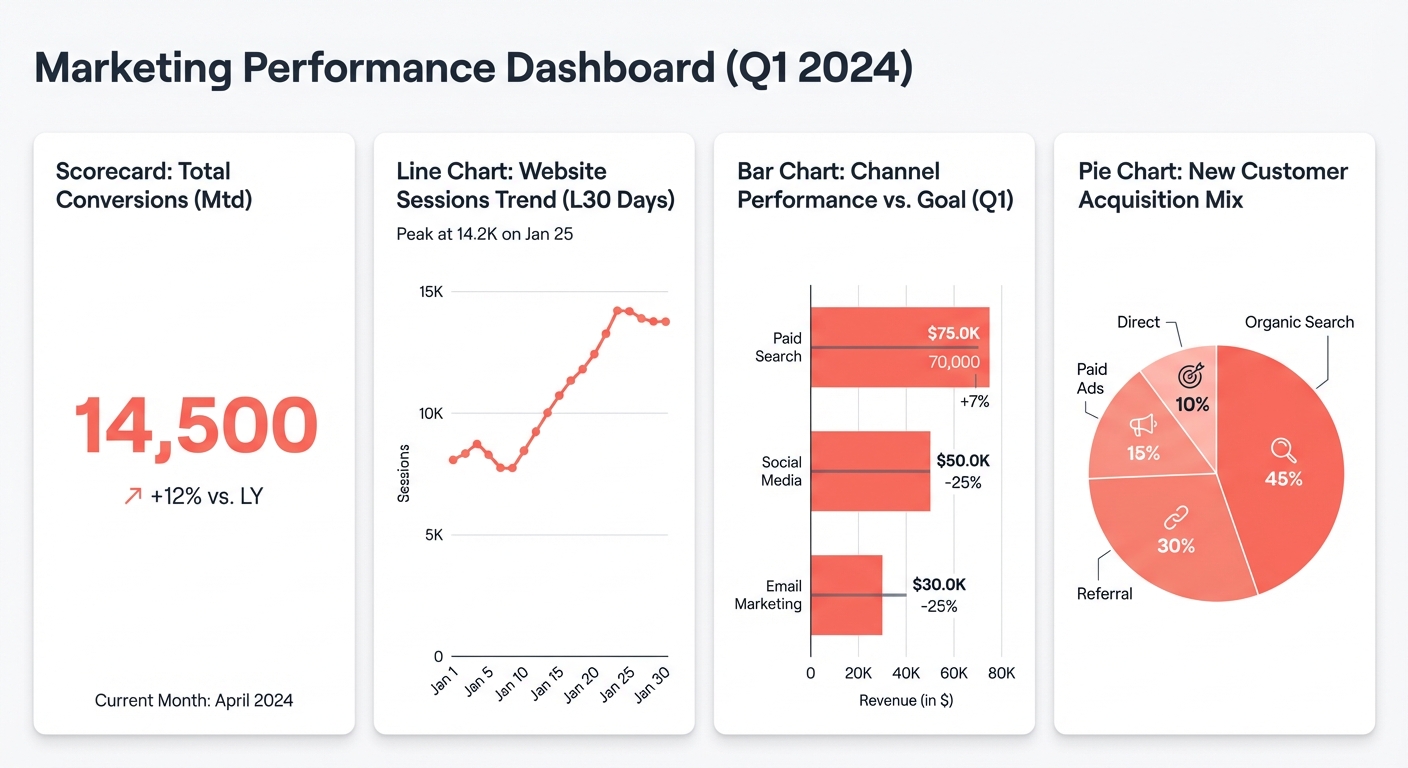 Four common chart types for marketing dashboards: scorecard, line chart, bar chart, and pie chart
Scorecards (KPI Cards)
Scorecards are the fastest way to communicate key metrics. We'll add four:
Adding your first scorecard:
- Click the "Insert" menu (top-left) → "Scorecard"
- Click and drag to create a box in the upper-left of your dashboard
- In the panel on the right, under "Data," click the data source dropdown and select "Google Ads"
- Under "Metric," search for and select "Total Spend"
- The scorecard now shows your total spend
Make it more useful with comparison:
- Expand the "Comparison period" section
- Select "Previous period" (day, week, or month depending on your needs)
- The scorecard now shows spend with a percentage change indicator
Format for clarity:
- Under "Style," change the decimal places to 0 (for dollar amounts)
- Add a secondary metric: In the metric dropdown, click "Add metric" and select "Conversions"
- The scorecard now shows two numbers
Add a sparkline for quick trend context:
- In the scorecard's "Style" tab, enable "Sparkline"
- The scorecard now shows a miniature trend line behind the number
- Viewers instantly see whether the metric is rising or falling without needing a full chart
Repeat this process to add three more scorecards:
- Conversions (with comparison)
- Cost Per Conversion (total spend ÷ conversions)
- Conversion Rate (conversions ÷ clicks)
[Screenshot: Four KPI scorecards showing spend, conversions, cost per conversion, and conversion rate]
Trend Charts (Time Series)
Trend charts show whether you're improving or declining over time.
Adding a trend chart:
- Click "Insert" → "Time series"
- Draw a wide box spanning the full width below your scorecards
- Under "Data," select "Google Ads"
- Under "Metric," select "Total Spend"
- Under "Breakdown Dimension," select "Date" (this automatically groups by day)
- Click "Add metric" and add "Conversions" on the same chart
Now your chart shows two lines: spend and conversions over time.
Customize the view:
- Change date granularity: Click the "Date" dimension, change from "Day" to "Week" if you prefer less granular data
- Add a secondary axis: In the right panel, find "Conversions" and toggle "Use secondary axis" to make both metrics visible at the same scale
Pro tip: For a single chart, limit to 2-3 metrics. More than that becomes confusing. If you need to visualize many metrics, use multiple charts instead.
[Screenshot: Trend chart showing spend and conversions with two-axis display]
Data Tables
Tables are the powerhouse of dashboards. They show detail and let viewers sort and filter.
Adding a campaign performance table:
- Click "Insert" → "Table"
- Draw a large box below the trend chart
- Select "Google Ads" as the data source
- Click "Add dimension" and select "Campaign Name"
- Click "Add metric" and add: "Total Spend," "Conversions," "Cost Per Conversion"
- The table now lists every campaign with three metrics
Make it interactive:
- In the right panel, toggle "Enable sorting" - viewers can click column headers to sort
- Toggle "Enable pagination" so viewers can navigate large tables
- Set "Rows per page" to 10 or 15
Add conditional formatting (heatmap):
- Find the metric you want to highlight (e.g., "Conversions")
- Click the three dots next to it → "Conditional formatting"
- Choose "Color scale" and set low values to red, high values to green
- Now high-performing campaigns stand out visually
[Screenshot: Campaign performance table with conditional formatting highlighting top performers]
Bar Charts
Bar charts make channel comparisons obvious.
Adding a channel comparison chart:
- Click "Insert" → "Bar chart"
- Draw a box in the middle of your dashboard
- Select "Google Ads" as the data source
- Under "Dimension," select "Device" or "Campaign Name" or "Network" (depending on what you want to compare)
- Under "Metric," select "Total Spend"
- Click "Add metric" and add "Conversions"
Make it effective:
- In the right panel, find the "Sort" dropdown and select "Conversions (descending)" to sort by best-performing channels
- Change the chart type from vertical to horizontal if you prefer (especially if channel names are long)
- Toggle "Show data labels" to display numbers on each bar
The chart now clearly shows which channels generate the most conversions.
[Screenshot: Horizontal bar chart comparing performance by channel, sorted by conversions]
Pie/Donut Charts
Pie charts answer "what's our budget allocation?" questions. Use sparingly—they're less precise than bars.
Adding a budget allocation chart:
- Click "Insert" → "Pie chart"
- Draw a smaller box to the right of your bar chart
- Select your data source
- Under "Dimension," select "Campaign" (or "Channel" if blending multiple sources)
- Under "Metric," select "Total Spend"
- Toggle "Show percentage" to label each slice
A pie chart works here because you're showing proportions (budget split), not comparisons (which channel is better).
[Screenshot: Pie chart showing budget allocation across three campaigns]
Step 5: Add Interactivity
Static dashboards are fine, but interactive ones are better. Let's add controls so viewers can customize what they see.
Date Range Controls
Adding date range picker:
- Click "Insert" → "Date range control"
- Place it in the top-right corner
- In the right panel, set "Default date range" to "Last 30 days" (or your preference)
- Under "Control type," select "Dynamic date range" for preset options like "Last 7 days," "Last month," etc.
Now every chart on your dashboard will automatically filter to the selected date range. Viewers can change the date range and all charts update instantly.
[Screenshot: Date range control showing dropdown menu with preset options]
Filter Controls
Filters let viewers focus on specific campaigns, channels, or other dimensions.
Adding a channel filter:
- Click "Insert" → "Drop-down list control"
- Place it next to the date range control
- In the right panel, select "Campaign Name" as the dimension
- Set "Default value" to "All" so all campaigns appear initially
- Check "Show all items" so viewers see every option
Now viewers can select a single campaign and all metrics update.
Add multiple filters:
Repeat the process to add filters for:
- Device type (Mobile, Desktop, Tablet)
- Network (Search, Display, YouTube) - if using Google Ads
- Platform (Google Ads, Meta, TikTok) - if blending sources
Filters automatically apply across all charts that share the same dimension.
Pro tip: Viewers can select multiple filters at once. The dashboard will show only data matching all selected filters.
[Screenshot: Filter controls showing campaign dropdown, device type, and network filters]
Drill-Down Pages
For detailed analysis, create separate dashboard pages that viewers can navigate to.
Creating a second page (Google Ads detail):
- At the bottom of your report, click the "+" icon to add a new page
- Name it "Google Ads Detail"
- Add charts focused on Google Ads metrics: keyword performance, ad copy, placement data, etc.
- Use filters to focus on Google Ads data only
Adding navigation:
- Go back to your main dashboard page
- Click on your channel comparison chart
- In the right panel, scroll down to "Drill-down" and enable it
- Select "Google Ads Detail" as the page to drill into
- Select "Campaign Name" as the drill-down dimension
Now when viewers click on a bar in your chart, they drill into that campaign's detail page automatically. Add a back button or breadcrumb to return to the main dashboard.
[Screenshot: Navigation between dashboard pages with drill-down interaction]
Step 6: Data Blending (Advanced)
So far we've used individual data sources. But what if you need to combine Google Ads data with Meta Ads data? That's where blending comes in.
When You Need Data Blending
You need blending when:
- You want a single chart showing all channels together
- You want to compare Google Ads cost per conversion against Meta's cost per conversion
- You want a unified "all campaigns" view across platforms
How Data Blending Works
Blending joins data from multiple sources based on a common key (usually date or campaign name).
Creating a blended data source:
- In your report, click the data icon (table) in the toolbar
- Click "Create new data source"
- Select your first source (e.g., "Google Ads")
- In the next screen, click "Blend data"
- Select the second source (e.g., "MetricNexus - Meta Ads")
- Under "Join keys," select the dimension both sources share (usually "Date" or "Campaign Name")
- Click "Blend"
Looker Studio now treats this as a single data source. You can add metrics from both Google Ads and Meta to the same chart.
Important Limitations
- Both data sources must share a common dimension to join on
- Looker Studio supports blending up to five data sources natively
- If one source updates faster than the other, data may not sync perfectly
- Complex blends slow dashboards because each blend generates multiple API calls
- For 3+ data sources, consider using a data warehouse (like BigQuery) or the Extract Data connector to cache results
When to Use a Data Warehouse Instead
If you're blending 3+ sources or need daily scheduled updates, a centralized data warehouse is better. Services like:
- BigQuery (Google, integrates directly with Looker Studio)
- Snowflake (with third-party connectors)
- MetricNexus cloud warehouse (all your data in one place)
These are faster, more reliable, and easier to maintain at scale.
For now, blending works great for 2-3 sources.
[Screenshot: Blended data source showing channels from both Google Ads and Meta]
Step 7: Calculated Fields and Custom Metrics
Calculated fields let you build metrics that don't exist in your raw data. This is where dashboards go from reporting to actual analysis.
Creating a Calculated Field
- Click the data icon in the toolbar and select your data source
- Click "Add a field" at the bottom of the field list
- Name your field and enter a formula
- Click "Save"
The field is now available as a metric or dimension in any chart using that data source.
Essential Marketing Formulas
ROAS (Return on Ad Spend):
Code block (markdown)SUM(Conversion value) / SUM(Cost)
This gives you a single number showing revenue per dollar spent. A ROAS of 3.0 means every dollar generates three dollars in revenue.
Cost Per Acquisition (CPA):
Code block (markdown)SUM(Cost) / SUM(Conversions)
Click-Through Rate (CTR):
Code block (markdown)SUM(Clicks) / SUM(Impressions)
CASE Statements for Channel Grouping
CASE statements are the most powerful function in Looker Studio's formula editor. They let you create custom groupings, relabel values, and build conditional logic.
Group campaigns by funnel stage:
Code block (markdown)CASE
  WHEN REGEXP_MATCH(Campaign, "(?i).*(brand|branded).*") THEN "Brand"
  WHEN REGEXP_MATCH(Campaign, "(?i).*(retarget|remarket|rmkt).*") THEN "Retargeting"
  WHEN REGEXP_MATCH(Campaign, "(?i).*(prospect|cold|tofu).*") THEN "Prospecting"
  ELSE "Other"
END
This formula scans campaign names using regex and assigns each to a funnel stage. Add it as a dimension, then use it in bar charts or tables to compare performance by stage instead of individual campaign.
Flag high-spend, low-conversion campaigns:
Code block (markdown)CASE
  WHEN Cost > 500 AND Conversions < 5 THEN "Underperforming"
  WHEN Cost > 500 AND Conversions >= 5 THEN "Healthy"
  WHEN Cost <= 500 THEN "Low Spend"
  ELSE "Review"
END
Use this as a dimension with conditional formatting to make problem campaigns immediately visible.
Classify device performance:
Code block (markdown)CASE
  WHEN Device = "MOBILE" AND Conversion_rate > 0.03 THEN "Mobile - Strong"
  WHEN Device = "MOBILE" AND Conversion_rate <= 0.03 THEN "Mobile - Weak"
  WHEN Device = "DESKTOP" THEN "Desktop"
  ELSE "Other"
END
REGEX for Campaign Naming Conventions
If your campaigns follow a naming convention like Brand_US_Search_Exact, you can extract components with REGEXP_EXTRACT:
Code block (markdown)REGEXP_EXTRACT(Campaign, "^([^_]+)")
This extracts the first segment before the underscore. Adjust the pattern to pull country, match type, or any other segment from your naming convention.
Performance Note on Calculated Fields
Each calculated field runs a computation on every row of data, every time the dashboard loads. Two to three calculated fields are fine. Ten or more will noticeably slow your report. For heavy calculations, precompute values in BigQuery or Google Sheets before connecting to Looker Studio.
Step 8: Performance Optimization
Slow dashboards don't get used. Looker Studio runs queries for each chart in real-time, so optimization matters as your dashboard grows.
Reduce Chart Count Per Page
Every chart on a page generates a separate API request. Five scorecards means five requests. Instead of four individual scorecards, consider using a single table with no dimensions that displays all four metrics in one row. This cuts four requests to one.
Break large dashboards across multiple pages. Looker Studio only loads charts on the currently viewed page, so splitting a 20-chart dashboard across three pages improves load time significantly.
Group Data Sources by Page
Place all charts using the same data source on the same page. If page one has three Google Ads charts and two Meta Ads charts, the browser makes API calls to both connectors simultaneously. Move Meta Ads charts to page two so each page only loads one connector.
Use the Extract Data Connector
For data sources that update daily (not real-time), the Extract Data connector creates a cached snapshot of your data. Reports using extracted data load nearly instantly because Looker Studio queries a local cache instead of the live API.
To set it up: click "Create new data source" and select "Extract Data." Choose your source, select only the fields you need, set a refresh schedule (daily is common), and connect.
The Extract Data connector has a 100MB storage limit, which covers most marketing dashboards.
Adjust Data Freshness Settings
Every data source has a "Data Freshness" setting that controls cache duration. The default is 12 hours. For dashboards viewed weekly, set this to 24 hours. For real-time monitoring, drop it to 1 hour. Find this under "Data source settings" for each connected source.
Minimize Filters and Calculated Fields
Filters apply across every chart on the page. Disable cross-filtering on charts that don't need it: select the chart, go to "Chart interactions" in the setup panel, and uncheck "Cross-filtering."
Pre-aggregate data in a warehouse (BigQuery, Google Sheets) instead of relying on Looker Studio to calculate sums and averages across millions of rows at query time.
Limit Table Rows
Set "Rows per page" to 10-25 instead of the default. Looker Studio only retrieves visible rows, so smaller pages mean faster loads. Viewers can still paginate through all data.
Step 9: Styling and Branding
A professional dashboard matches your brand and is easy on the eyes.
Color Scheme Consistency
- Choose a primary color (your brand color)
- Choose 2-3 secondary colors for data series (usually blue, orange, green)
- Use a neutral gray or white for backgrounds
In Looker Studio, set colors per chart:
- Click a chart
- In the right panel, find "Color" or "Series color"
- Select your brand colors
Alternatively, click the three dots in the top-right → "Report settings" → "Theme" to set colors globally.
Font Choices
- Click "Report settings" → "Theme"
- Under "Fonts," select a clean, professional font
- Recommended: Open Sans, Montserrat, or Roboto (Google Fonts)
- Avoid script or overly decorative fonts—they hurt readability
Logo and Branding
- Click "Insert" → "Image"
- Draw a box in the top-left corner
- Upload your company logo
- Make it small (50-60px tall) so it doesn't dominate
[Screenshot: Dashboard header with logo, title, and date range control]
White Space
Don't cram charts together:
- Leave breathing room between components
- Use one chart per row if possible
- Group related information (e.g., KPIs together, tables below)
Mobile Considerations
Looker Studio dashboards are responsive, but:
- Test on a mobile phone: Click the three dots → "View report"
- Ensure charts are readable at small sizes
- Stack components vertically on mobile automatically (you don't need to do anything)
New Looker Studio Features (2025-2026)
Several recent updates make marketing dashboards more powerful:
Gemini AI Integration (2024-2025). Looker Studio Pro subscribers can use Gemini to create calculated fields using natural language. Instead of writing a CASE statement manually, describe what you want: "Group campaigns containing 'brand' as Brand and everything else as Non-Brand." Gemini generates the formula. Conversational Analytics also lets you ask questions about your data in plain English and get chart-based answers.
Responsive Reports (March 2025). Dashboards now auto-adjust to different screen sizes using a 12-column grid with flexible vertical sections. This eliminates the need to build separate mobile layouts. Enable it under "Report settings."
Query Result Variables (March 2025). You can insert live data values directly into text elements. Click a cell in a table, mark it as a "query result," and reference it in a text box. The value updates automatically as data refreshes. Combined with conditional formatting, text can change color based on thresholds (e.g., red when CPA exceeds your target).
Modern Chart Styling (February 2025). Charts now support rounded edges, gradient line styles, and transparency controls. These options appear under the "Style" tab and give reports a more polished look without custom CSS.
Slack Integration (October 2025, Pro only). Automated report delivery to Slack channels. Reports post as PDFs with a direct link back to Looker Studio.
Free Marketing Dashboard Templates
Rather than build from scratch, you can copy a free template and customize it:
Template includes:
- 4 KPI scorecards
- 1 trend chart
- 1 bar chart comparing channels
- 1 detailed campaign table
- Date range and filter controls
- Professional styling
[Link to template download - coming soon]
To customize any template:
- Click "Use template" or "Make a copy"
- Create a copy in your Google account
- Click the data icon and change data sources from the demo data to yours
- Adjust dimensions and metrics to match your needs
Most users can customize a template in 5-10 minutes.
Community Template Galleries
If you want more options, several free template galleries exist:
- Looker Studio Report Gallery - Google's official showcase of community-created dashboards
- Supermetrics Template Gallery - Templates for paid media, social, SEO, and ecommerce (requires Supermetrics connector)
- Porter Metrics Templates - 80+ free templates for Facebook Ads, Google Ads, GA4, and social media
- Data Bloo Templates - Ecommerce, SEO, and PPC-focused templates
All of these follow the "Make a copy" workflow. Connect your own data sources after copying and you'll have a working dashboard in minutes.
Common Dashboard Mistakes to Avoid
Learn from others' missteps:
1. Too Many Metrics (Overwhelm)
Problem: Dashboard shows 30+ metrics, viewers don't know what to focus on.
Solution: Stick to 10-15 metrics maximum. For managers, use: Spend, Conversions, ROI, CPC, CPA. For executives, use just: Spend, Revenue, ROI.
2. No Context (Meaningless Numbers)
Problem: Chart shows "485 conversions" with no reference point.
Solution: Always add comparison. Is 485 conversions up or down vs last month? Add "vs previous period" to scorecards and trend lines showing goals.
3. Confusing Layouts
Problem: Charts randomly scattered, no logical flow.
Solution: Use the layout from Step 3: Overview metrics → Trends → Comparisons → Detail.
4. Missing Filters
Problem: Viewers can't drill into specific campaigns or channels.
Solution: Add drop-down filters for at least Campaign, Channel, and Device Type.
5. Stale Data (Trust Issues)
Problem: Dashboard shows "last updated 3 weeks ago."
Solution: Add a timestamp. In Looker Studio, click "Insert" → "Text" and type "Last updated: [current date]" or use the refresh timestamp if your data source supports it.
[Screenshot: Dashboard with common mistakes highlighted and annotations for improvements]
Sharing and Embedding
Your dashboard is useless if viewers can't access it.
Share via Link
- Click "Share" in the top-right
- Toggle "Share with others"
- Set permissions:
- Editor - viewers can edit (good for team dashboards)
- Viewer - read-only (good for client reports)
- Copy the link and send to viewers
- They'll see your dashboard update in real-time as data refreshes
Embed in Your Website
Want the dashboard on your website? Looker Studio supports embedding:
- Click the three dots → "Embed report"
- Customize the size and appearance
- Copy the embed code
- Paste into your website's HTML
Embedded dashboards show live data and update automatically.
Schedule Email Delivery
For client reports, schedule automatic email delivery:
- Click the three dots → "Schedule email delivery"
- Select recipients and frequency (daily, weekly, monthly)
- Looker Studio sends a PDF snapshot to their inbox on schedule
This is perfect for automated client reporting without manual work.
FAQ
Is Looker Studio really free?
Yes. Looker Studio is 100% free to use forever. There are no limits on dashboards, viewers, or data size. You only pay if you add paid connectors like Supermetrics ($99/month) or MetricNexus ($99/month for agencies), but basic Google Ads and GA4 connections are free.
Can I connect Facebook Ads to Looker Studio directly?
Not natively. Facebook doesn't provide a direct connector. You need a third-party tool:
- MetricNexus (recommended for Looker Studio)
- Supermetrics
- Google Sheets + Facebook marketing API (manual)
How do I share a Looker Studio dashboard with my client?
- Click "Share" → toggle "Share with others"
- Set their permission level (Viewer for read-only)
- Copy the link and send it
- They'll see live data updates in real-time
No login required for viewers (unless you restrict to specific people).
What's the difference between Looker and Looker Studio?
Looker Studio is the free, self-serve product. Looker (the full BI platform) is an enterprise product ($5K+/year) for large organizations needing advanced governance, scheduling, and team collaboration features. For small businesses and marketing teams, Looker Studio is perfect.
How often does my data refresh?
It depends on the data source:
- Google Ads: Within 24 hours (sometimes faster)
- GA4: Within 1 hour
- Third-party connectors: Varies (typically 6-24 hours)
You can manually refresh by clicking the refresh icon in your report.
Can I export my dashboard?
Yes. Click the three dots → "Download as PDF" for a static report. For scheduled exports, use the email delivery feature.
Why is my Looker Studio dashboard slow?
The most common causes: too many charts on one page (each generates a separate API request), multiple data sources loading simultaneously, and heavy calculated fields. Fix it by splitting charts across pages, grouping charts by data source, using the Extract Data connector for cached snapshots, and keeping calculated fields to a minimum. See the Performance Optimization section above for details.
Can I use Looker Studio with AI?
Yes. As of 2025, Looker Studio Pro integrates Gemini AI for two features: a Formula Assistant that creates calculated fields from natural language descriptions, and Conversational Analytics that lets you ask questions about your data in plain English. Both require a Looker Studio Pro subscription.
Next Steps
You now have a professional marketing dashboard. Here's what to do next:
1. Download the free template and customize it for your data (5 min)
2. Connect more data sources - add Meta Ads, TikTok, or other platforms (10 min)
3. Build calculated fields - start with ROAS and CPA formulas, then try CASE statements for campaign grouping (see Step 7 above)
4. Share with your team - send the link to colleagues and gather feedback (5 min)
5. Advanced tutorials:
- How to set up data blending across multiple platforms
- Creating drillable dashboards with multiple pages
- Advanced visualization techniques
Your first dashboard will take an hour. Your second will take 15 minutes. By your third, you'll be creating dashboards faster than you can write the queries yourself.
Start today—your dashboard is waiting.
Related Posts

How to Connect Google Ads to Looker Studio (Free Guide)
Step-by-step guide to connecting Google Ads to Looker Studio. Includes free dashboard template and common troubleshooting tips.

How to Connect Google Analytics 4 to Looker Studio
Complete guide to connecting GA4 to Looker Studio. Build website analytics dashboards with native integration - no tools required.

The Complete Guide to Marketing Data (For Non-Technical Teams)
Everything you need to know about marketing data - without the jargon. A practical guide for marketers who aren't data engineers.
Ready to see your marketing data?
Start your free trial today. See your data in 5 minutes.
Start Free Trial