How to Connect Google Analytics 4 to Looker Studio
Complete guide to connecting GA4 to Looker Studio. Build website analytics dashboards with native integration - no tools required.
MetricNexus Team

Google Analytics 4 (GA4) and Looker Studio are both Google products, which means they integrate seamlessly without any third-party tools or additional costs. If you're looking to visualize your website traffic data in a professional dashboard, this native integration is your fastest path forward.
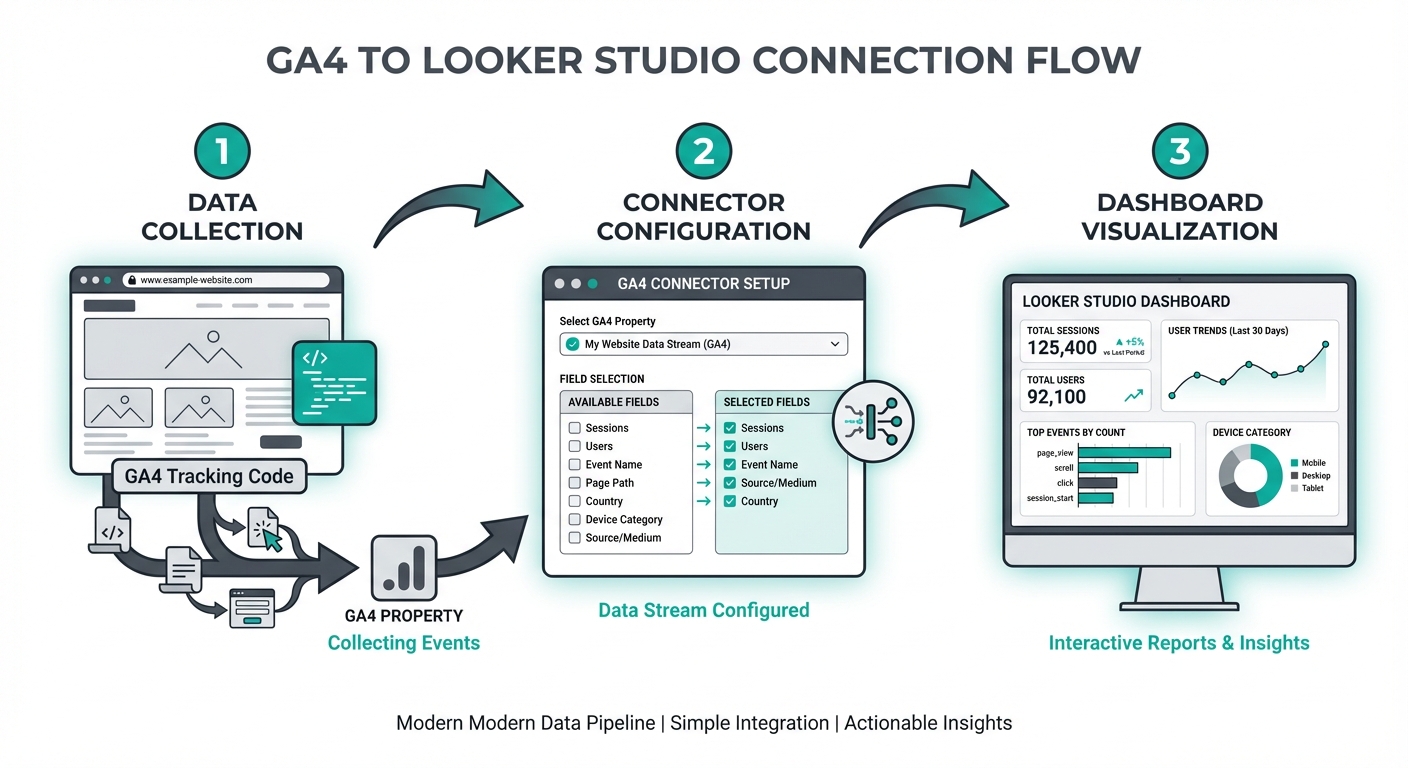 GA4 to Looker Studio connection flow showing data collection, connector configuration, and dashboard visualization
In this guide, you'll learn exactly how to connect GA4 to Looker Studio and build meaningful reports in minutes. We'll also cover the key differences between GA4 and the older Universal Analytics (if you're transitioning), plus practical calculated fields and troubleshooting tips.
Prerequisites
Before you start, make sure you have:
- A GA4 property with data collection active - If you've just created it, you may need to wait 24 hours for initial data to appear
- A Google account with Looker Studio access - Looker Studio is free for anyone with a Google account
- Viewer or higher access to your GA4 property - At minimum, you need to be able to view the data in Google Analytics
You don't need any special tools, plugins, or expensive connectors. The native Google Analytics connector in Looker Studio handles the connection automatically.
Step-by-Step Connection
Step 1: Create a New Looker Studio Report
- Visit looker.google.com/looker-studio and sign in with your Google account
- Click the "Create" button (usually in the top-left corner)
- Select "Report" from the dropdown menu
- You'll be taken to a blank report with a modal asking you to add your first data source
Step 2: Search for and Select the GA4 Connector
In the connector selection modal:
- Search for "Google Analytics" in the search box
- You'll see two options: one labeled "Google Analytics" (GA4) and possibly "Google Analytics (Universal Analytics)"
- Select the "Google Analytics" option - this is the native GA4 connector
- Note: Universal Analytics (older version) has a separate connector. Make sure you're choosing the GA4 one to access current data
Step 3: Authorize Access
- Click on the GA4 connector and you'll be prompted to authorize access
- Select the Google account that has access to your GA4 property
- Review the permissions and click "Allow" to grant Looker Studio access to your GA4 data
- You'll be returned to Looker Studio and the authorization will be confirmed
Step 4: Select Your GA4 Property
- In the data source configuration panel, you'll see a dropdown for Account
- Select your Google Analytics account from the dropdown
- Next, select your Property from the second dropdown
- GA4 doesn't use "Views" like Universal Analytics did - you just select the property directly
- Click "Create" to establish the connection
Step 5: Configure Data Source Settings
- Once connected, you can optionally set default filters and segments
- Set a default date range for your reports (e.g., Last 30 Days, Last 90 Days)
- You can add default segments if you want to focus on specific user groups by default
- Click "Add to Report" to add this data source to your dashboard
Your GA4 data is now connected to Looker Studio and ready to visualize.
Understanding GA4 Dimensions and Metrics
GA4 represents a major shift from Universal Analytics, not just in the interface but in how data is structured. Understanding key dimensions and metrics is crucial for building useful reports.
Key Dimensions in GA4
Dimensions are attributes that describe your data. Here are the most important ones:
- Session source/medium - Where traffic came from and how (organic/cpc/referral/direct)
- Page path - Which pages users visited
- Device category - Mobile, desktop, or tablet
- Country/Region - Geographic location of users
- Event name - Custom events you've set up to track specific actions
Key Metrics in GA4
Metrics are the numbers that measure user behavior:
- Active users - Unique users who engaged with your site (replaces the old "Users" metric)
- Sessions - The number of user sessions (similar to Universal Analytics)
- Engaged sessions - Sessions where users engaged with meaningful content
- Engagement rate - The percentage of sessions where users were engaged
- Conversions - Completed conversion events (must mark events as conversions in GA4 settings)
- Event count - Total number of events fired
- Session duration - How long a session lasted
Understanding GA4 Data Scopes
GA4 organizes data into four distinct scopes, and understanding these is crucial for building accurate reports:
| Scope | What It Measures | Example Dimensions | Example Metrics |
|---|---|---|---|
| User | Individual visitors across sessions | User ID, First user source | Total users, New users |
| Session | Single visit to your site | Session source/medium | Sessions, Engaged sessions |
| Event | Individual interactions | Event name, Page path | Event count, Conversions |
| Item | E-commerce products | Item name, Item category | Item revenue, Items purchased |
Why scopes matter in Looker Studio:
You cannot combine dimensions and metrics from incompatible scopes in the same chart. For example:
- Combining "Page path" (event scope) with "Sessions" (session scope) works
- Combining "Item name" (item scope) with "Active users" (user scope) may produce unexpected results
If you see "Invalid combination" errors in Looker Studio, check that your dimensions and metrics share compatible scopes.
What Changed from Universal Analytics?
GA4's biggest conceptual shift is from session-based to event-based tracking. In Universal Analytics, you had a limited set of metrics. GA4 lets you define what matters through events.
Key differences:
- Bounce rate is gone - GA4 uses "Engagement rate" instead (inverse measure)
- No "Users" metric - You now have "Active Users" which counts users who engaged
- Conversions are opt-in - You must explicitly mark events as conversions in GA4 settings
- More flexible custom events - You can track virtually any user action, not just pageviews
- Better multi-touch tracking - GA4 better tracks users across devices and sessions
Building Essential Reports
Now that you understand the data structure, let's build useful reports.
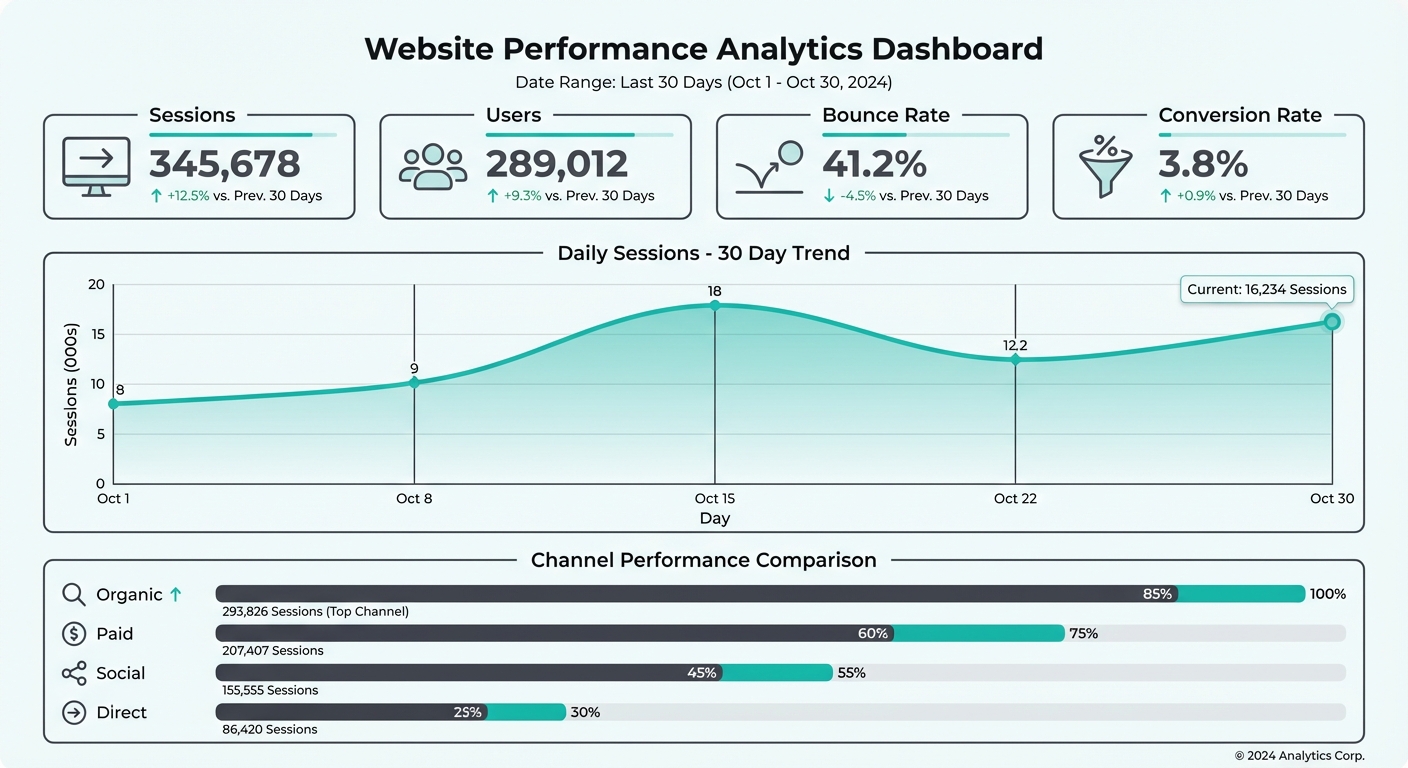 Analytics dashboard showing key metrics, traffic trends, and performance indicators
Traffic Overview Report
This is your "at-a-glance" dashboard showing overall site performance:
-
Create a line chart showing Active Users over time (Last 30 Days)
- X-axis: Date
- Y-axis: Active Users
- This shows you traffic trends at a glance
-
Create a table of Sessions by Source/Medium
- Rows: Source/Medium
- Values: Sessions
- This tells you which channels drive the most traffic
-
Create a pie chart of New vs Returning Users
- Dimension: User Type
- Metric: Active Users
- This shows your ratio of new to returning visitors
-
Add a scorecard showing today's users compared to yesterday
- Metric: Active Users
- This gives executives a quick performance check
Acquisition Report
Understand where your traffic comes from:
-
Create a table of Source/Medium performance
- Rows: Source, Medium (or Source/Medium)
- Values: Sessions, Engaged Sessions, Engagement Rate
- Sort by Engaged Sessions (descending)
-
Create a pie chart for traffic by channel type
- If you've set up channel groupings in GA4, use that
- Otherwise, segment by Source/Medium
-
Add campaign performance if you're running paid campaigns
- Dimension: Campaign
- Metrics: Sessions, Conversions, Engagement Rate
- This helps you identify which campaigns drive results
Engagement Report
See how visitors interact with your content:
-
Create a table of Top Pages
- Rows: Page Path
- Values: Active Users, Session Duration, Engagement Rate
- This shows which pages create the most engagement
-
Add a metric for Average Session Duration
- Shows how long users stay on your site
-
Create a bar chart of Events by Event Name
- Dimension: Event Name
- Metric: Event Count
- This shows which custom events (if any) are firing most
-
Add scroll depth tracking (if configured)
- Create a custom event for scroll_depth
- Track percentage of users who scroll to different depths
Conversion Report
Track business outcomes:
-
Create a scorecard showing total conversions
- Metric: Conversions (if you've marked events as conversions)
-
Create a table of conversion events by source
- Rows: Source/Medium
- Values: Conversions, Conversion Value (if applicable)
- This shows which channels deliver actual results
-
Add a conversion funnel (if you've set up conversion events)
- Dimension: Event Name
- Metric: Conversions
- This helps identify where users drop off
GA4 vs Universal Analytics in Looker Studio
If you're migrating from Universal Analytics, here's what to expect:
| Metric | Universal Analytics | GA4 |
|---|---|---|
| Total Users | Users | Active Users |
| Bounce Rate | Bounce Rate (%) | Use (Sessions - Engaged Sessions) / Sessions |
| Avg Session Duration | Average Session Duration | Session Duration (measured differently) |
| Pages/Session | Pages per Session | Event Count / Sessions (approximate) |
| Conversions | Goals | Events marked as conversions (you choose) |
Important differences:
- GA4 doesn't have built-in bounce rate - You'll need to calculate it with a formula
- GA4 sessions are longer - GA4 extends sessions to 30 minutes (UA was 30 min) and considers engagement
- GA4 requires configuration - You must explicitly mark events as conversions in GA4 settings, then they'll appear here
- GA4 is more flexible - You can track any custom event, making it more powerful than Universal Analytics' limited goals
Calculated Fields for GA4
Looker Studio lets you create calculated fields to derive metrics that aren't natively available. Here are useful formulas for GA4:
Bounce Rate (Approximation)
Since GA4 doesn't have bounce rate, approximate it with:
Code block (markdown)(Sessions - Engaged Sessions) / Sessions
This shows the percentage of sessions where users didn't engage meaningfully. In Looker Studio, create a calculated field with this formula and format as percentage.
Pages per Session
To approximate pages viewed per session:
Code block (markdown)Event Count / Sessions
Note: This counts all events, not just pageviews, so it's an approximation. For a more accurate pageview count, filter events to only page_view events.
Conversion Rate
Track what percentage of sessions result in conversions:
Code block (markdown)Conversions / Sessions
This metric is essential for evaluating channel quality and overall site effectiveness.
Cost Per Conversion (with Google Ads data)
When blending with Google Ads:
Code block (markdown)Cost / Conversions
This shows which ad spend delivers results. Costs come from Google Ads, conversions from GA4.
Engagement Percentage
Show the inverse of bounce rate (percentage of engaged sessions):
Code block (markdown)Engaged Sessions / Sessions
Combining GA4 with Other Data
Looker Studio's real power comes from combining data sources.
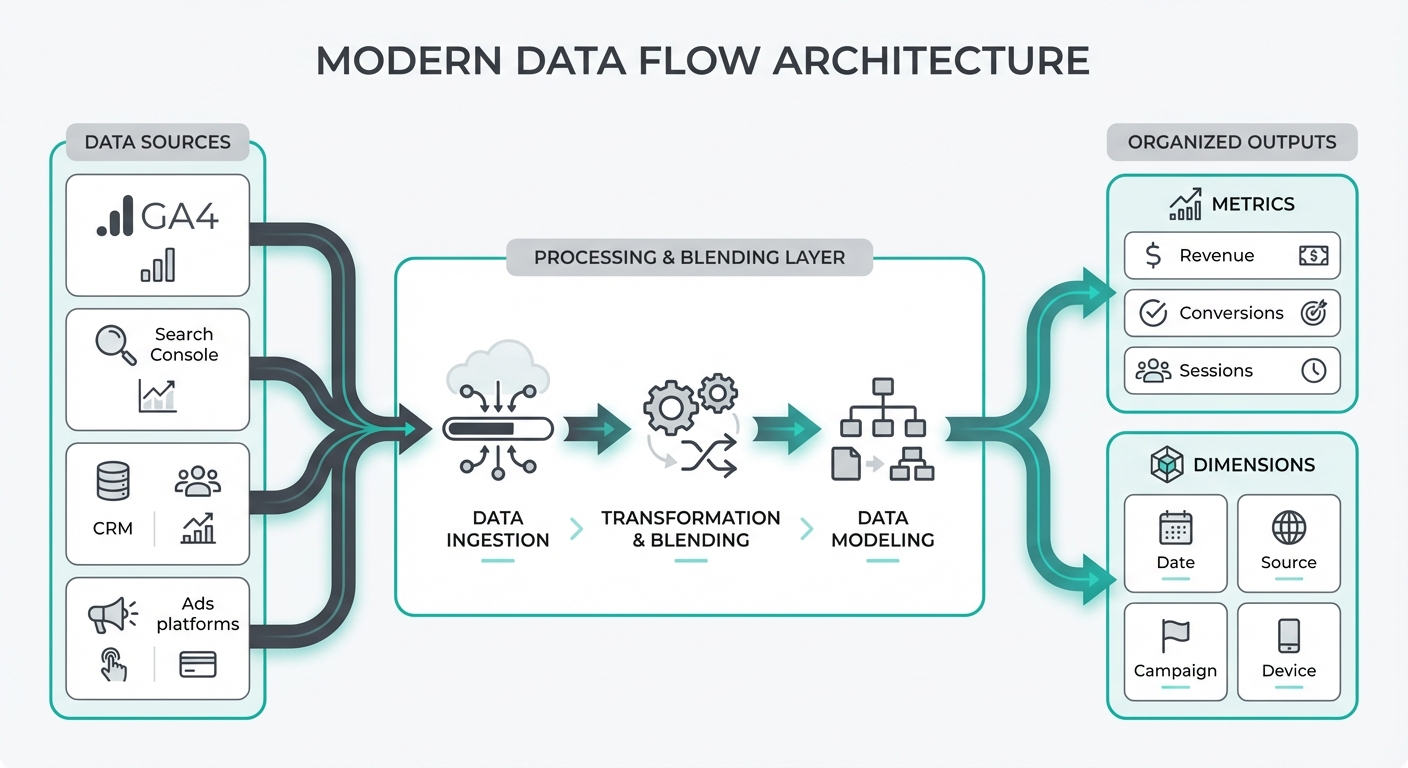 Data flow architecture showing multiple sources flowing through processing into organized metrics and dimensions
Blending with Google Ads
If you're running Google Ads campaigns:
-
Create a second data source by clicking "Resource" → "Manage added data sources" → "Create new data source"
-
Select Google Ads connector and authorize
-
Select your Google Ads account and campaign
-
Create calculated fields to blend the data:
- ROAS (Return on Ad Spend): Conversions / Cost
- CPC (Cost Per Click): Cost / Clicks
- CTR (Click Through Rate): Clicks / Impressions
-
Use Date as your join key between GA4 and Google Ads
-
Create reports showing ad spend alongside conversion data
Note on attribution: GA4 and Google Ads may attribute conversions differently. GA4 uses its own attribution model (data-driven, position-based, time-decay) while Google Ads uses last-click attribution. This can cause discrepancies - this is normal.
Blending with Other Sources
You can also blend GA4 with:
- Google Search Console - Combine search performance with site behavior
- CRM data - Upload lead data and compare to traffic sources
- Custom spreadsheets - Import product data, pricing, or manual tracking
When blending multiple sources, establish clear join keys (usually Date or Campaign) to ensure data aligns correctly.
Common Issues and Fixes
GA4 Data Doesn't Match the GA4 Interface
GA4 Looker Studio reports may show slightly different numbers than the GA4 interface. Causes:
- Sampling - Large date ranges trigger sampling in Looker Studio (see next section)
- Filters - If you've set up filters in the GA4 property itself, Looker Studio applies them
- Date comparisons - Ensure your date ranges match between the interface and Looker Studio
Fix: Use the same date range in both places. If numbers differ significantly, check for active filters.
Missing Metrics in GA4
You can't find "Bounce Rate," "Pages per Session," or other Universal Analytics metrics.
Fix: These aren't native to GA4. Use calculated fields (see the "Calculated Fields" section above) to recreate them.
Can't See Conversions
You've created events in GA4 but they don't appear as "Conversions" in Looker Studio.
Fix: In GA4 Settings, navigate to Events and mark your desired events as conversions. Looker Studio syncs this setting, and the data will appear within 24 hours.
Reports Are Running Slow
Large date ranges (6+ months) or high-cardinality dimensions (like Page Path with thousands of pages) slow reports down.
Fix:
- Add filters to limit data scope
- Use smaller date ranges in individual reports
- Avoid cross-tabulating many high-cardinality dimensions
No Real-Time Data
Looker Studio doesn't update in real-time like the GA4 interface does.
Fix: For real-time monitoring, use the GA4 interface's Real-Time report. Looker Studio reports update every few hours.
GA4 API Quota Limits in Looker Studio
When connecting GA4 to Looker Studio, you're using the GA4 Data API, which has quota limits that can affect your reports.
Core quota limits:
- Tokens per day: 25,000 tokens per project per day
- Tokens per hour: 5,000 tokens per project per hour
- Concurrent requests: 10 concurrent requests per property
How quotas affect your dashboards:
- Each chart or table in your report consumes tokens
- Complex queries with many dimensions use more tokens
- Reports with date comparisons double the token usage
- Blended data sources multiply API calls
Strategies to stay within limits:
- Reduce report complexity - Fewer charts means fewer API calls
- Use data extracts - For historical data, export to BigQuery or Sheets and connect those instead
- Limit date ranges - 30-day reports use fewer tokens than 90-day reports
- Cache aggressively - Set reports to refresh daily instead of hourly
- Consolidate properties - If you have multiple GA4 properties, consider consolidating data in BigQuery
Monitoring your quota: You can check your API quota usage in the Google Cloud Console under "APIs & Services" > "Google Analytics Data API" > "Quotas."
Looker Studio Platform Limits
Beyond API quotas, Looker Studio itself has structural limits:
| Resource | Limit |
|---|---|
| Pages per report | 100 |
| Components per page | 50 |
| Data sources per report | 100 |
| Canvas width | 10px to 2,000px |
| Canvas height | 10px to 10,000px |
| Fields per data source | 800 |
Practical implications:
- Large dashboards with 50+ charts should be split across multiple pages
- Executive summaries work well on a single page; detailed breakdowns need separate pages
- If you hit component limits, consider using drill-down interactions instead of showing everything at once
GA4 Sampling in Looker Studio
When you request large amounts of data, GA4 may use sampling - analyzing a subset of your data rather than 100% - to return results quickly.
When sampling occurs:
- Date ranges over 90 days on smaller properties
- High-cardinality requests (many dimensions with diverse values)
- Reports including custom events with low volume
How to identify sampled data:
- Looker Studio shows a sampling indicator in the chart details
- Percentages that don't add up exactly (99.8% instead of 100%) suggest sampling
Strategies to reduce sampling:
- Use shorter date ranges - 30-day reports avoid sampling on most properties
- Limit dimensions - Avoid combining many dimensions in one report
- Add filters - Narrowing your audience reduces data volume
- Use segments - GA4 segments process data more efficiently than filters
For critical business reports, stick to 30-day rolling windows and simple dimension combinations.
Best Practices
Follow these practices to build efficient, reliable GA4 dashboards:
-
Use segments for focused reports - Instead of filtering, use GA4 segments to isolate user groups. Segments are pre-processed and load faster.
-
Set appropriate date ranges - 30-day reports are optimal. 90-day reports work well. Avoid 1+ year ranges unless necessary.
-
Cache your reports - For executive dashboards that don't need real-time data, set them to update once daily (not hourly). This saves processing power.
-
Be specific with filters - Filter to the exact data you need. Too many filters slow reports and may trigger sampling.
-
Organize by audience - Create separate reports for different audiences (executives vs. marketers). Executives want KPIs; marketing teams want granular data.
-
Document calculated fields - Make notes on which calculated fields you used and why. This helps when others edit your dashboards.
-
Test with different date ranges - Ensure your dashboard patterns hold across different time periods, not just the current month.
FAQ
Is GA4 free to connect to Looker Studio?
Yes. Both Google Analytics 4 and Looker Studio are free. The native connector is included at no cost.
Why doesn't GA4 data match my Looker Studio dashboard?
Common causes: sampling on large date ranges, filters applied in GA4 settings, different attribution models, or time zone differences. Use the same date range and filters in both places to verify.
Can I use Universal Analytics and GA4 together in the same report?
Yes, using data blending. Create two data sources (one Universal Analytics, one GA4) and join them by date. However, note that metrics are calculated differently, so correlating them is tricky.
How do I add custom GA4 events to Looker Studio?
Custom events appear automatically once they start collecting data in GA4. After 24 hours of data collection, you'll see the event name in the Dimensions list in Looker Studio. No special configuration needed.
Can I share my Looker Studio dashboard with my team?
Yes. Click Share and invite team members by email. They can view, edit, or have view-only access depending on permissions you set.
Next Steps
You've now built your first GA4 dashboard in Looker Studio. Here's what to do next:
- Explore advanced features - Try blending GA4 with Google Ads data to see cost-per-acquisition
- Build a marketing dashboard - Combine Looker Studio with other data sources (Search Console, email platform data) into one unified view
- Set up alerts - Use Looker Studio's alert features to notify you when metrics dip
- Share with stakeholders - Create department-specific views (executive summary, detailed acquisition report, etc.)
The native GA4-Looker Studio integration is just the start. As you grow, you can layer in additional data sources to build a comprehensive marketing intelligence platform.
Related Posts

How to Connect Google Ads to Looker Studio (Free Guide)
Step-by-step guide to connecting Google Ads to Looker Studio. Includes free dashboard template and common troubleshooting tips.

How to Build a Marketing Dashboard in Looker Studio (2026)
Complete guide to building a marketing dashboard in Looker Studio. Connect multiple data sources and create professional reports.

The Complete Guide to Marketing Data (For Non-Technical Teams)
Everything you need to know about marketing data - without the jargon. A practical guide for marketers who aren't data engineers.
Ready to see your marketing data?
Start your free trial today. See your data in 5 minutes.
Start Free Trial