How to Connect Google Ads to Looker Studio (Free Guide)
Step-by-step guide to connecting Google Ads to Looker Studio. Includes free dashboard template and common troubleshooting tips.
MetricNexus Team

Good news: Google Ads has a native Looker Studio connector, making this one of the easiest integrations you can set up. No APIs to configure, no third-party tools, no monthly fees. Just a few clicks and you'll be pulling your Google Ads data directly into Looker Studio dashboards.
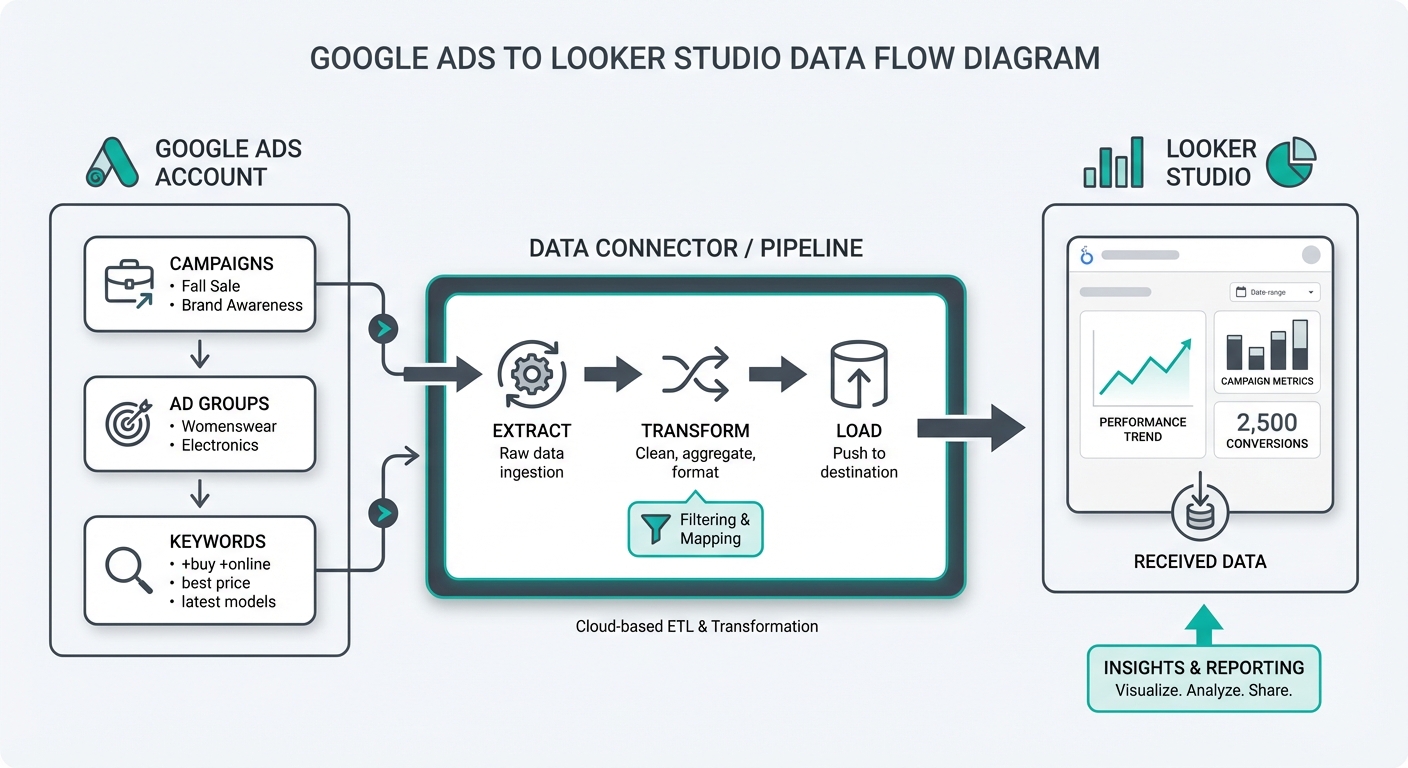 Google Ads to Looker Studio data flow
In this guide, I'll walk you through the complete setup process, show you the essential metrics to track, share a free dashboard template, and help you build reports that actually drive decisions. Whether you're managing a small Google Ads account or overseeing multiple campaigns, this tutorial will save you hours of manual reporting.
Prerequisites
Before you start, make sure you have the following in place:
Your Google Ads account:
- An active Google Ads account with at least some historical data (ideally a few weeks so your reports aren't empty)
- Admin or reporting access to the account(s) you want to connect. If you're an agency managing multiple client accounts, you'll need access to each one
- If you're using a Manager Account (MCC), you can connect at either the MCC level or individual account level—we'll cover both approaches. Note: MCC accounts can report on up to 50 sub-accounts per data source
Your Looker Studio access:
- A Google account with Looker Studio access (it's free and part of Google's Analytics suite)
- Editor or Admin permission on the report you'll be creating (or the ability to create a new report from scratch)
That's it. No credit card required, no special setup. The connector is built directly into Looker Studio.
Native vs. Third-Party Connectors
While this guide focuses on the free native connector, you might wonder about third-party options like Supermetrics, Coupler.io, or Catchr. Here's how they compare:
| Feature | Native Connector | Third-Party Connectors |
|---|---|---|
| Cost | Free | $30-300/month |
| Setup time | 5 minutes | 10-15 minutes |
| Data refresh | Every 12 hours | Hourly or on-demand |
| Data blending | Manual in Looker Studio | Built-in transformation tools |
| Row limits | Standard Google limits | Often unlimited |
| Support | Google documentation | Dedicated support teams |
| Best for | Single-account reporting | Agencies, multi-client dashboards |
For most small businesses and solo advertisers, the native connector is all you need. Third-party connectors become valuable when you're managing 10+ accounts, need faster refresh rates, or want to blend Google Ads data with non-Google sources before it reaches Looker Studio.
Step-by-Step Setup
Step 1: Open Looker Studio and Create a New Report
Start by opening Looker Studio in your browser. You'll see the home dashboard with your existing reports and data sources.
Click the Create button in the top left, then select Report from the dropdown menu. This opens a blank report with a blank canvas ready for your first data source.
Step 2: Search for the Google Ads Connector
Now you need to add your Google Ads data as a data source. In the blank report, you'll see a prompt to add data or click the data icon in the toolbar. Click on it, and you'll see the connector library.
In the search bar, type "Google Ads" and look for the official Google Ads connector (it has a blue Google Ads icon). Make sure you're selecting the official connector from Google, not a third-party one. The official version is free and always up-to-date.
Click on the Google Ads connector to proceed.
Step 3: Authorize and Select Your Account
Google will now ask you to authorize Looker Studio to access your Google Ads account. You'll see a standard OAuth flow where you select your Google account and approve the permission request.
Once authorized, you'll see a dropdown showing all the Google Ads accounts you have access to. If you manage multiple accounts:
- For individual account: Select the specific account you want to connect
- For Manager Account (MCC): You can either select the MCC itself (to see aggregated data from child accounts) or select individual client accounts
Choose the account(s) you want to report on. You can always add more data sources later if you need to compare multiple accounts.
Step 4: Configure Your Data Source
After selecting your account, Looker Studio will show you the data source configuration options. Here's what matters:
Date range defaults: Choose whether you want the report to default to the last 30 days, last 90 days, or a custom range. You can change this for each report, so pick whatever you'll use most often.
Account selection: Confirm you've selected the right account (this is your last chance to change it before the data source is created).
Currency settings: If your account operates in multiple currencies, Looker Studio will convert everything to your default currency. Verify this is what you want.
Once you've reviewed these settings, click Create Data Source. Looker Studio will now connect to your Google Ads account and make the data available to your report.
Step 5: Build Your First Chart
Looker Studio will automatically create a blank chart in your report. You now have your first data source connected—time to add some actual visualizations.
For your first chart, start with something simple: a line chart showing spend over time. This immediately shows you if your account is active and the data is flowing correctly.
Click on the chart area, then use the Data panel on the right to:
- Set the date field as your dimension (X-axis)
- Add Cost (or Spend) as your metric (Y-axis)
You should immediately see a line chart with your daily or weekly Google Ads spend. If you see data, you're connected correctly.
Next, add a second chart: a table showing campaign performance. Add these columns:
- Campaign (dimension)
- Spend (metric)
- Clicks (metric)
- Conversions (metric)
- ROAS or Cost per Conversion (metric)
This gives you a quick view of which campaigns are performing best.
Free Google Ads Dashboard Template
Rather than starting from scratch, you can copy a pre-built dashboard template that includes all the essential reports most Google Ads managers need.
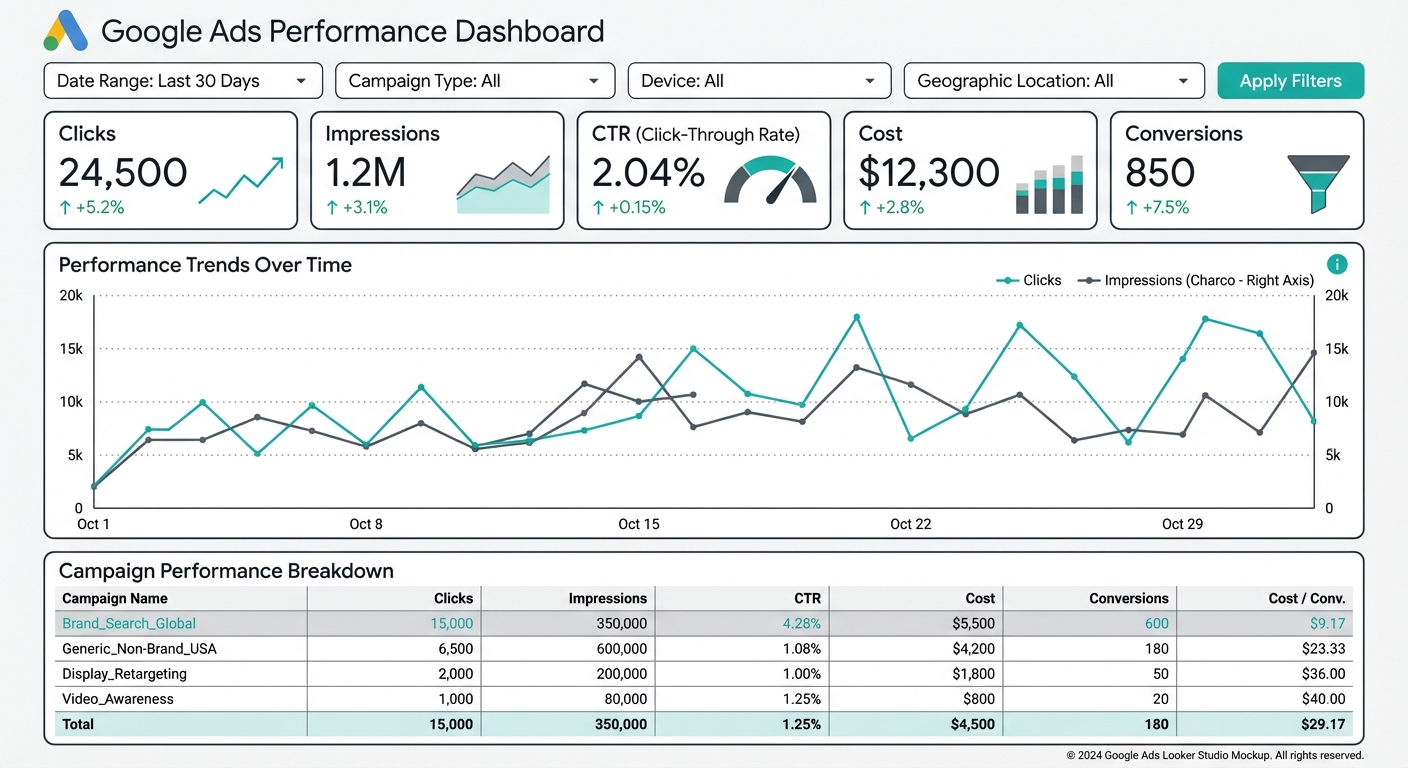 Google Ads Looker Studio dashboard layout
Our free template includes:
- Campaign Performance Overview — A summary table and scorecard showing total spend, clicks, conversions, and ROAS at a glance
- Keyword Analysis — Top performing keywords and those underperforming (so you know where to pause spend)
- Ad Copy Performance — Which ads are driving the most conversions and the lowest cost per conversion
- Device Breakdown — Performance across desktop, mobile, and tablet so you can adjust bids by device
- Geographic Performance — Which locations are converting best, useful for local targeting and bid adjustments
- Time-of-Day Analysis — When your best customers search, so you can increase bids at peak times
To use the template, click here to make a copy to your Looker Studio account (link to be updated with actual template URL).
Once you've copied it, simply connect it to your Google Ads account following Steps 1–4 above, and all the charts will populate with your data automatically.
Essential Metrics to Include in Your Reports
Not every metric is worth tracking in your dashboard. Focus on these key groups:
Cost Metrics
These tell you how much you're paying for visibility and clicks:
- Cost — Total spend on the campaign, ad group, or keyword
- Average CPC (Cost Per Click) — How much you're paying per click. Lower is generally better, but context matters (branded keywords cost less)
- Average CPM (Cost Per Thousand Impressions) — Useful for display and YouTube campaigns where you're buying impressions rather than clicks
- CPV (Cost Per View) — For video campaigns, how much you're paying per view
Performance Metrics
These show how your ads are being seen and clicked:
- Impressions — How many times your ads appeared in search results
- Clicks — How many people clicked your ads
- CTR (Click-Through Rate) — Percentage of impressions that resulted in clicks. Benchmark: 2-5% for search, 0.5-2% for display
- Search Impression Share — What percentage of available impressions your ads captured (useful for identifying budget constraints)
Conversion Metrics
These are where the real value is—they show whether your ads are actually driving business results:
- Conversions — Total number of actions (purchases, leads, signups, etc.) attributed to your ads
- Conversion Rate — Percentage of clicks that resulted in a conversion
- Cost Per Conversion — Your cost to acquire one customer/lead (divide spend by conversions)
- Conversion Value — Total revenue or value generated from conversions
- ROAS (Return on Ad Spend) — Revenue divided by spend. If you spent $1,000 and made $5,000, your ROAS is 5:1
Industry benchmarks for conversion metrics:
| Industry | Avg. Conversion Rate | Avg. Cost Per Conversion |
|---|---|---|
| E-commerce | 2.5-3.5% | $45-65 |
| B2B/SaaS | 2.0-3.0% | $75-150 |
| Legal Services | 4.0-6.0% | $80-120 |
| Healthcare | 3.0-4.5% | $50-90 |
| Real Estate | 2.5-4.0% | $60-100 |
These are rough benchmarks—your actual targets depend on your margins, lifetime value, and business model.
Quality Metrics
These indicate whether Google and your customers think your ads are relevant:
- Quality Score — Google's rating of your keywords and ads (1-10). Higher is better. 7+ is good, 8+ is excellent
- Search Impression Share — What % of eligible searches showed your ad. Missing share often means budget constraints or low bids
- Search Top Impression Share — What % appeared at the top of the page. Useful for competitive analysis
Building Common Reports
Now let's build the specific reports most Google Ads managers need.
Campaign Performance Report
This is your most important report—it shows the health of each campaign at a glance.
Setup:
- Create a table visualization
- Add dimensions: Campaign, Campaign Status
- Add metrics: Cost, Clicks, Impressions, Conversions, Cost Per Conversion, ROAS
- Sort by Cost (descending) so highest-spend campaigns appear first
Add interactivity:
- Right-click the Campaign column and add a filter—now viewers can drill down to see specific campaigns
- Format the metrics with appropriate decimal places (Cost as currency with 2 decimals, ROAS with 1 decimal)
- Add conditional formatting to the ROAS column to highlight campaigns with ROAS > 3 in green and ROAS < 2 in red
This report immediately shows which campaigns are profitable and which need attention.
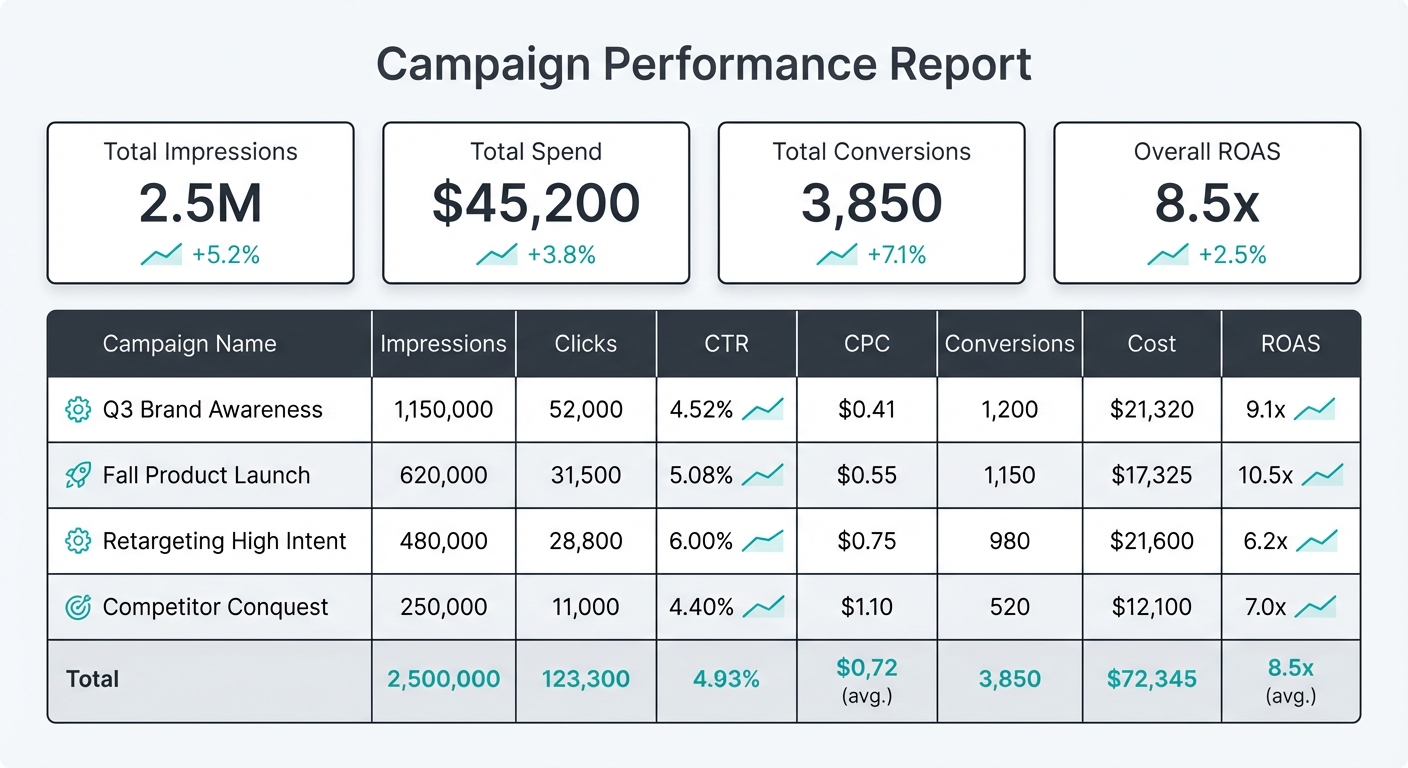 Campaign performance report with metrics
Keyword Analysis Report
Understanding keyword performance is crucial for optimizing bids and identifying wasted spend.
For top performing keywords:
- Create a table with Keyword, Cost, Clicks, Conversions, Cost Per Conversion
- Filter to show only keywords with Conversions > 0
- Sort by Conversion Rate (descending)
- This shows you your "cash cows"—keywords converting at the lowest cost
For negative keyword candidates:
- Create a second table showing keywords with > 10 clicks but 0 conversions
- These are often good candidates for negative keywords (so you stop showing ads for irrelevant searches)
- Add a column for Search Query Report insights (requires linking to Google Ads interface)
Quality score tracking:
- Create a scorecard or gauge showing average Quality Score
- Add a second column breaking down Quality Score by status: excellent (8-10), good (5-7), poor (1-4)
- This helps you prioritize keyword optimization—focus on those 8-10 first
Time-Based Analysis
When your customers search matters. Use time-based analysis to find high-converting hours and days.
Day of week performance:
- Add Day of Week as a dimension
- Show metrics for Cost, Clicks, Conversions, Cost Per Conversion
- This reveals if weekends convert differently than weekdays (they often do for B2C)
- Use the insights to adjust your bid schedules—increase bids on high-converting days
Hour of day patterns:
- Add Hour of Day as a dimension
- Show Cost and Conversions
- Visualize as a column chart—you'll quickly see your peak converting hours
- Many businesses find their best hours are 9-11am and 2-4pm (during work day)
Seasonal trends:
- Create a line chart with Month as the dimension and Cost/Conversions as metrics
- Look for seasonal patterns—retail increases November-December, tax services spike in March-April
- Use this for annual budget planning
Advanced Tips
Once you've mastered the basics, here are some advanced techniques that professional Google Ads managers use.
Blending Google Ads with GA4
Google Ads tells you how much you spent and how many clicks you got. GA4 tells you what those clicks did on your website. Combining both gives you the complete picture.
How to blend the data:
- Create two data sources: one for Google Ads, one for GA4
- Both should have Campaign as a dimension
- Use the Campaign name as the join key
- Create a calculated field: Revenue / Ad Spend = ROAS
Important caveat: Google Ads and GA4 often report different numbers. Why? Attribution models. Google Ads uses last-click attribution (the last ad someone clicked before converting). GA4 uses data-driven attribution. These will never match perfectly, and that's normal.
When to use each:
- Use Google Ads data for: Ad spend, impression share, quality score, estimated metrics
- Use GA4 data for: On-site behavior, time on page, bounce rate, revenue
- Use both: For complete campaign analysis with context
Calculated Fields
Looker Studio lets you create custom metrics beyond what Google Ads natively provides.
Useful calculated fields:
- Profit: If you track Cost Per Conversion, you can create: Conversion Value - (Cost Per Conversion × Conversions)
- Efficiency Ratio: Conversions ÷ Clicks × 100 (percentage of clicks that convert)
- ROAS Category: Using IF statements, create "High" (ROAS > 3), "Good" (ROAS > 2), "Low" (ROAS < 2) for easier visualization
- Benchmark Comparison: If you're comparing to historical data, calculate the variance: (This Month - Last Month) ÷ Last Month × 100
These calculated fields appear in your Data tab and can be reused across all charts in the report.
Filters and Controls
Make your reports interactive so stakeholders can explore the data themselves.
Date range controls:
- Add a date range filter at the top of your report
- Default to Last 30 Days, but allow viewers to select custom ranges
- Every chart will automatically update
Campaign dropdown filter:
- Add a filter dropdown listing all campaigns
- Viewers can select one campaign or multiple to compare
- Especially useful if you have 20+ campaigns and want to drill down
Device and Network filters:
- Add a filter for Device (Desktop, Mobile, Tablet)
- Add a filter for Network (Search, Display, YouTube, etc.)
- These help viewers focus on specific performance segments
Common Issues and Solutions
Even with the native connector, you might run into issues. Here's how to fix them:
"My data doesn't match Google Ads interface"
Cause: Attribution model differences. Google Ads shows last-click attribution by default. Looker Studio might be showing a different model.
Solution: In your Google Ads connector settings, verify the attribution model. If it's not clear, check Google Ads directly and note the discrepancy—it's usually within 5-10%.
"Some of my campaigns aren't showing"
Cause: You don't have access to those campaigns, or they're filtered out.
Solution: Verify in Google Ads that you have access. In your Looker Studio data source, check if there's an Account filter limiting the results.
"My metrics show (not set)"
Cause: You're mixing dimensions that don't have data. For example, using Keyword with Display Network (keywords don't apply to display ads).
Solution: Check your dimensions. Display campaigns won't have keyword-level data. Create separate reports for Search and Display.
"My report is very slow to load"
Cause: You're pulling too much data at once (e.g., showing all keywords for 12 months).
Solution: Add filters (date range, campaign, account) to limit the dataset. A 30-day report with filtered campaigns will load much faster than a 12-month report with all data.
Google Ads vs GA4: Which Should You Use?
Both are important, and they serve different purposes. Here's how to decide:
Use the Google Ads connector when you need:
- Ad spend and cost metrics (CPC, CPM, Cost Per Conversion)
- Impression share and search impression share
- Quality Score tracking
- Keyword-level performance data
Use the GA4 connector when you need:
- On-site user behavior (pages visited, time on site, bounce rate)
- Cross-channel attribution (how other channels contributed to the conversion)
- E-commerce metrics (revenue, average order value)
- User demographics and interests
Best practice: Use both with data blending. Connect Google Ads for your cost and ad metrics, then connect GA4 to see the resulting website behavior. This gives you the complete marketing funnel view.
Frequently Asked Questions
Is it really free to connect Google Ads to Looker Studio?
Yes, completely free. Looker Studio is a free Google product, and the Google Ads connector is part of it. No paid plans, no connector fees, no data limits. You're only paying for your Google Ads campaigns, not the reporting.
Why doesn't my Looker Studio report match what I see in Google Ads?
The most common reason is attribution model differences. Google Ads uses last-click attribution, but Looker Studio might be showing data-driven attribution or a different model. Small discrepancies (5-10%) are normal. If the difference is larger, check your filters and dimensions—you might be looking at different data (e.g., all devices vs. mobile only).
Can I see search query data in Looker Studio?
Not directly from the Google Ads connector. Search query reports (showing the exact searches that triggered your ads) are more detailed than what Looker Studio pulls. For search query analysis, you'll need to export from Google Ads or use a third-party tool. However, you can see keyword-level data, which gets you most of the way there.
Can I connect multiple Google Ads accounts to one report?
Yes. Add a second data source and select a different Google Ads account. Then create charts that reference either or both sources. You can even blend them to compare account performance side-by-side.
How often does the data update?
Google Ads data in Looker Studio updates with a 3-4 hour delay. Your report won't show real-time data, but it will be current by afternoon for morning activity. If you need real-time data, Google Ads interface is your source of truth.
Next Steps
Now that you're connected and have built your first reports:
- Duplicate the free template to jumpstart your dashboard
- Set up daily review — Every morning, check your top metrics (spend, conversions, ROAS)
- Create team access — Share your report with your team or clients using Looker Studio's sharing controls
- Automate delivery — Schedule the report to email to stakeholders weekly
- Explore advanced features — Once comfortable, dive into calculated fields and data blending
Related Tutorials
Ready to expand your marketing analytics? Here are some related guides:
- How to Connect GA4 to Looker Studio — Combine ad spend with on-site behavior
- Build a Complete Marketing Dashboard in Looker Studio — Dashboard pulling data from Google Ads, GA4, Meta, and more
- Connect Meta Ads to Google Sheets — Track your Facebook and Instagram ad performance
Related Posts

How to Connect Google Analytics 4 to Looker Studio
Complete guide to connecting GA4 to Looker Studio. Build website analytics dashboards with native integration - no tools required.

How to Build a Marketing Dashboard in Looker Studio (2026)
Complete guide to building a marketing dashboard in Looker Studio. Connect multiple data sources and create professional reports.

How to Connect Meta Ads to Google Sheets (5-Minute Setup)
Connect your Facebook and Instagram Ads data to Google Sheets automatically. Step-by-step guide with free template included.
Ready to see your marketing data?
Start your free trial today. See your data in 5 minutes.
Start Free Trial