Databox Alternatives for Small Business Analytics
Looking for Databox alternatives? Compare 7 KPI dashboard and analytics tools with pricing and features for small businesses.
MetricNexus Team
Databox is known for its beautiful KPI dashboards and comprehensive benchmark data. But if you're looking for alternatives—whether due to pricing concerns, feature limitations, or the need for greater flexibility—you have several strong options worth considering.
In this guide, we'll compare Databox with seven compelling alternatives, helping you find the tool that best fits your business needs and budget.
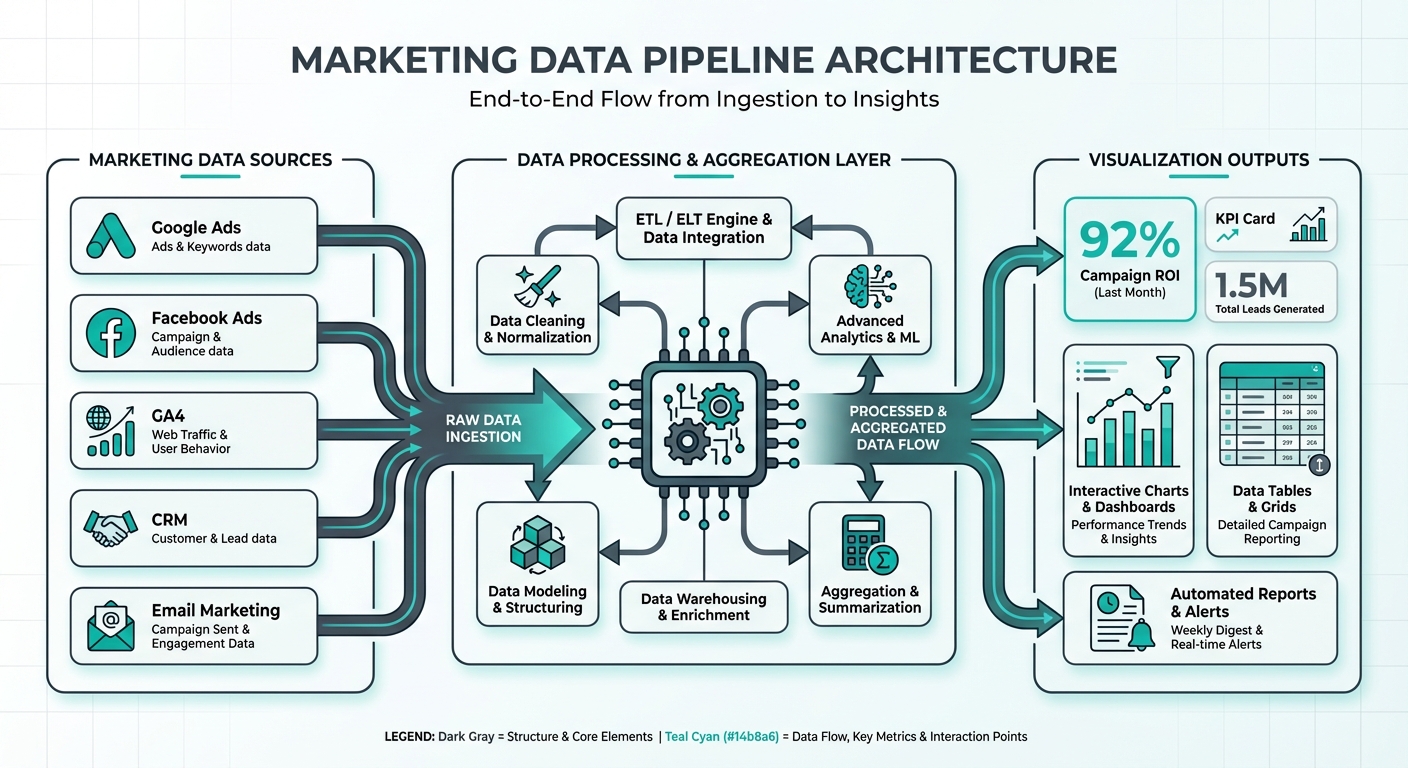 Dashboard data flow architecture showing how marketing data sources connect to visualization outputs
What Databox Does Well
Before diving into alternatives, it's worth acknowledging what Databox excels at. Understanding the platform's strengths will help you evaluate whether an alternative truly addresses your gaps or if Databox remains the best fit.
Mobile app excellence: Databox's native mobile application is genuinely industry-leading. It's intuitive, fast, and gives you true access to your dashboards on the go—not just a responsive website squeezed onto a small screen.
Benchmark data: Databox's industry benchmark groups are unique. You can compare your KPIs against peers in your industry, market size, and geographic region. This competitive intelligence is genuinely difficult to replicate elsewhere.
Design templates: Pre-built dashboard templates save significant setup time. Whether you're tracking marketing metrics, sales KPIs, or operational health, Databox provides thoughtfully designed starting points.
TV dashboard mode: The full-screen, auto-rotating dashboard view is perfect for war rooms and command centers. Team members can monitor key metrics in real-time without any interaction.
Goal tracking: Built-in goal setting and progress tracking make it easy to monitor whether you're hitting targets—and by how much.
Lead capture: Databox's native lead generation features integrate directly into dashboards, making it useful for companies that want to gather prospects while sharing metrics.
This feature set—particularly the mobile app and benchmark data—creates a sticky product that many users are reluctant to leave.
Why People Look for Alternatives
Despite Databox's strengths, businesses seek alternatives for several consistent reasons:
Pricing at scale: Databox's per-user licensing model means costs climb quickly as your team grows. A team of five users can easily spend $500+/month, making it expensive for growing organizations.
Limited data manipulation: While Databox excels at visualization, it's constrained for advanced data transformation, custom calculations, and complex aggregations. If you need to heavily manipulate raw data before visualization, you'll hit Databox's ceiling quickly.
Visualization lock-in: You're limited to Databox's pre-designed visualizations and customization options. If you want a chart style or layout that doesn't exist in their templates, you're out of luck.
Export limitations: Getting your data out of Databox is surprisingly difficult. If you need to share raw data or export for further analysis, you're restricted.
Need for raw data access: Some teams need the underlying data as a data warehouse or analytics source for other tools. Databox isn't designed to serve that purpose.
Lack of AI-powered insights: Databox doesn't offer natural language querying or AI-assisted analytics. You have to manually configure every dashboard and metric. Industry analysts predict that by 2027, half of all business decisions will be powered or automated by AI—making this gap increasingly significant.
These pain points typically manifest around 12-18 months into using Databox, as organizations either grow their team or develop more sophisticated analytics needs.
The cost of poor data visibility compounds over time. Research shows companies lose an average of $12.9 million per year due to poor data quality—a figure that includes time spent fixing data issues, missed opportunities from delayed insights, and decisions made on incomplete information.
Quick Comparison
Here's a snapshot of seven Databox alternatives:
| Tool | Best For | Free Tier | Starting Price | Mobile App |
|---|---|---|---|---|
| MetricNexus | AI-queryable marketing data | 14-day trial | $49/mo | Web-responsive |
| Google Looker Studio | DIY dashboards, budget | Yes, unlimited | Free | Limited |
| Klipfolio | Highly customized dashboards | Limited | $125/mo | Yes |
| Geckoboard | TV dashboards, teams | 14-day trial | $39/mo | Yes |
| Cyfe | Budget-friendly all-in-one | Yes | $19/mo | Yes |
| Whatagraph | Agency reporting, white-label | 7-day trial | $199/mo | No |
| AgencyAnalytics | Marketing agency clients | 7-day trial | $79/mo | Yes |
1. MetricNexus: AI-Powered Marketing Analytics
MetricNexus takes a fundamentally different approach to dashboard tools. Instead of starting with pre-built visualizations, you ask questions about your data in plain English.
Best for: Marketing teams who spend less time configuring dashboards and more time asking questions about marketing performance. Ideal if you're tired of manual dashboard maintenance.
Pricing: $49/month for starter tier, scaling to $199/month for enterprise teams. The key difference is per-user costs—MetricNexus charges per account, not per team member.
Mobile experience: Web-responsive design works on mobile, though it's not a native app. Desktop-first interface.
Key advantages:
- Natural language queries mean anyone on your team can explore data without SQL or dashboard configuration skills
- AI-generated insights surface anomalies and patterns automatically
- Raw data access for exporting and further analysis
- Built specifically for marketing metrics, not generic dashboards
- No visualization ceiling—AI can generate chart types as needed
Key disadvantages:
- Limited TV dashboard mode (you can share dashboards, but they're not optimized for display screens)
- Smaller benchmark community (though SMB marketing benchmarks are published separately)
- Newer product with smaller user base than Databox
MetricNexus shines when your team values flexibility and data exploration over polished, preset visualizations.
2. Google Looker Studio: The Free Powerhouse
Google Looker Studio (formerly Data Studio) is Google's free alternative to tools like Databox. It connects to Google Analytics, Google Ads, and hundreds of other data sources.
Best for: Budget-conscious teams, particularly those already using Google's marketing tools. Excellent for internal dashboards where mobile access isn't critical.
Pricing: Completely free. You only pay for underlying data sources (like Google Ads or Analytics).
Mobile experience: Works on mobile via responsive design, but lacks native apps and optimizations. Not suitable for mobile-first teams.
Key advantages:
- Zero cost—genuinely powerful analytics for free
- Deep integration with Google marketing ecosystem (Analytics, Ads, Search Console, etc.)
- Extremely flexible with custom calculations, formulas, and data blending
- Good for teams familiar with Google products
- Can handle complex visualizations and data transformations
Key disadvantages:
- No mobile app—purely web-based
- No native benchmark data
- No alerts or automated notifications
- Slower than purpose-built dashboard tools
- Limited TV dashboard features
- Steeper learning curve for non-technical users
Looker Studio is unbeatable if your primary data sources are Google's products and you're willing to invest time learning the platform. For teams without mobile requirements, it's genuinely feature-competitive with paid tools at a tenth of the cost.
3. Klipfolio: Maximum Customization
Klipfolio positions itself as the "build anything" dashboard tool. If you can imagine a dashboard, Klipfolio claims you can build it.
Best for: Teams with highly specific dashboard requirements and someone dedicated to configuring them. Excellent for SaaS companies with custom metrics.
Pricing: $125/month for basic tier, scaling to $400+/month for enterprise. Per-user costs are comparable to Databox but feature-rich.
Mobile experience: Native mobile app with good performance.
Key advantages:
- Exceptional flexibility—component library is extensive
- Advanced data transformation capabilities
- Custom calculations and metrics without coding
- Good visualization library
- Team features including collaboration on dashboard builds
Key disadvantages:
- Steep learning curve—building dashboards requires configuration knowledge
- No benchmark data
- Slower implementation than drag-and-drop competitors
- Overkill for simple dashboard needs
- Support quality is inconsistent across regions
Klipfolio is the choice for teams that have outgrown Databox's visualization constraints and are willing to invest time in configuration. Think of it as the Photoshop vs. Canva approach—more powerful but more complex.
4. Geckoboard: Beautiful Simplicity for Teams
Geckoboard is designed for teams who want beautiful, simple dashboards without deep technical configuration. It's the middle ground between Databox's design and Klipfolio's flexibility.
Best for: Teams valuing simplicity and aesthetics, particularly those using shared team dashboards or TV displays. Operations teams, product teams, and small sales organizations.
Pricing: $39/month for basic tier, scaling to $99+/month for larger teams. Straightforward per-user model.
Mobile experience: Solid native mobile app with good performance.
Key advantages:
- Beautiful, minimalist design out-of-the-box
- Excellent TV dashboard mode with auto-refresh
- Simple setup—most dashboards take 15 minutes to configure
- Good mobile app
- Integrates with 100+ data sources
- Strong customer support
Key disadvantages:
- Less flexible than Klipfolio for advanced use cases
- No AI-powered insights
- Limited data transformation capabilities
- No benchmark data
- Smaller ecosystem of templates compared to Databox
Geckoboard is Databox's closest direct competitor. If you value simplicity and design-first aesthetics, Geckoboard may actually offer a better user experience, particularly for team dashboards.
5. Cyfe: The Budget Option
Cyfe is positioned as the most affordable all-in-one dashboard and analytics tool. It combines dashboarding with social listening, SEO tracking, and website analytics in one platform.
Best for: Solopreneurs and very small teams watching multiple channels (social, SEO, web analytics, ads) on a single dashboard.
Pricing: $19/month for starter, $49/month for growth, $99/month for pro. Most affordable option available.
Mobile experience: Mobile app available, though interface feels dated compared to competitors.
Key advantages:
- Lowest cost entry point
- All-in-one platform (dashboards + social listening + web analytics)
- Decent integration library (100+ sources)
- Includes social media monitoring
- TV dashboard support
Key disadvantages:
- Interface looks dated compared to competitors
- Limited mobile app quality
- Fewer templates than Databox
- Less powerful than specialized tools
- Customer support is email-only, slower response times
Cyfe is perfect if you're running a solo business or bootstrap startup and need basic dashboarding. As you scale, you'll likely outgrow it, but for early-stage companies, the $19/month price point is unbeatable.
6. Whatagraph: Agency Reporting at Scale
Whatagraph is built for digital agencies managing dashboards for multiple clients. It's a reporting tool first, dashboarding tool second.
Best for: Marketing agencies providing client reporting, especially those wanting white-label solutions.
Pricing: $199/month minimum for agency tier, scaling to $500+/month for larger agencies. Separate pricing for individual users ($29/month).
Mobile experience: No native mobile app. Web-responsive only.
Key advantages:
- Beautiful client-ready reports
- White-label options for agencies
- Powerful API for custom integrations
- Excellent report scheduling and automation
- Strong for multi-account management
- Good customer success team for onboarding
Key disadvantages:
- Most expensive option ($199/mo minimum)
- No mobile app
- Report-focused, not dashboard-focused
- Not ideal for internal-only teams
- Overkill for non-agencies
Whatagraph is the choice if you're an agency and client reporting is your primary use case. The white-label and multi-client features justify the premium pricing for that specific market.
7. AgencyAnalytics: Marketing Agency Focus
AgencyAnalytics is similar to Whatagraph but positioned slightly differently—more dashboard-first while still supporting white-label client reporting.
Best for: Marketing agencies wanting dashboards that clients can access directly, especially those managing multiple client accounts.
Pricing: $79/month for starter, $159+/month for growth. Agency-appropriate pricing.
Mobile experience: Native mobile app for viewing client dashboards.
Key advantages:
- Built specifically for marketing agencies
- Easy client account management
- Excellent visualization for marketing metrics
- Native mobile app
- Good data source library (100+)
- Client-friendly interface
Key disadvantages:
- Premium pricing
- Agency-specific features may be overkill for in-house teams
- Not ideal if you need raw data access
- Smaller visualization library than Databox
- Learning curve for complex dashboards
AgencyAnalytics is Whatagraph's closest competitor, with a slightly lower price point but less reporting flexibility.
Feature Comparison Matrix
Here's a detailed feature comparison across popular alternatives:
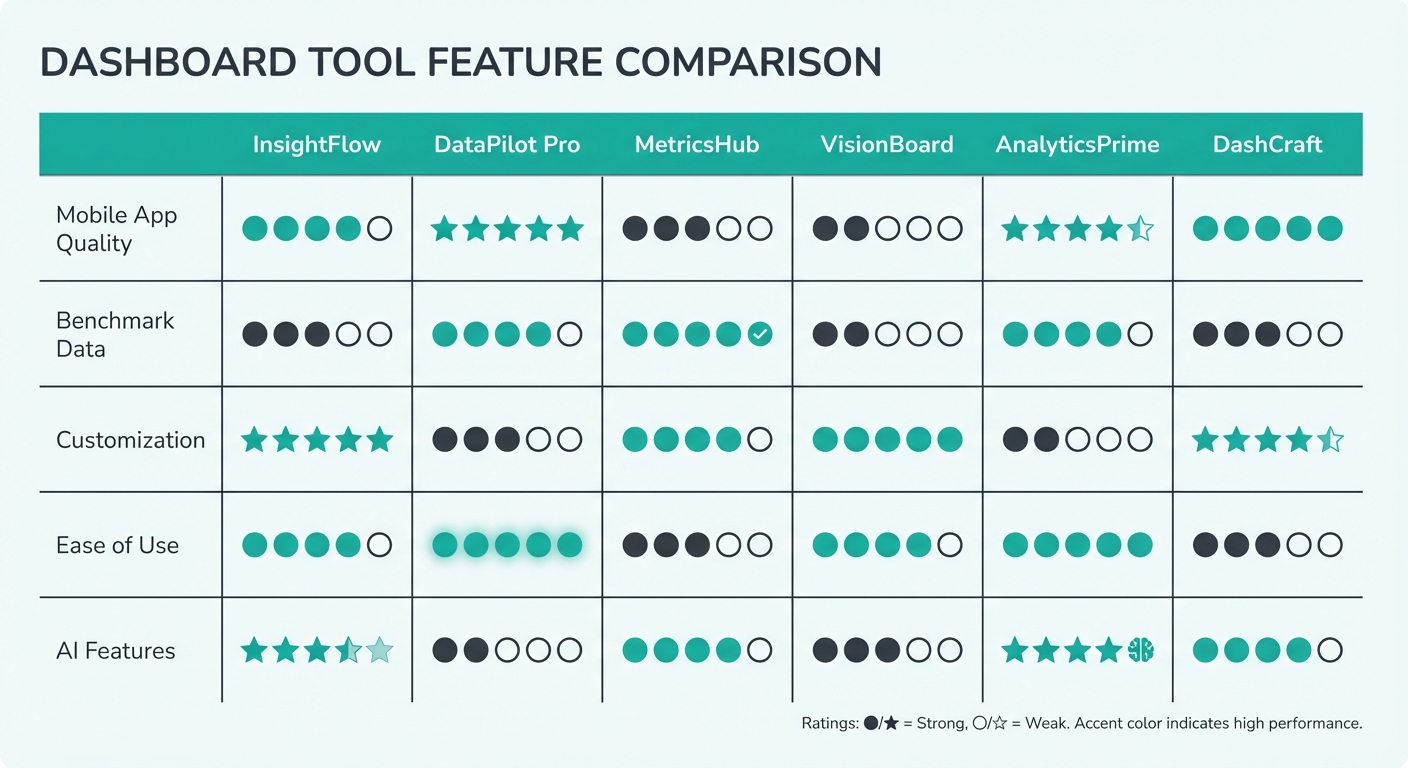 Feature comparison matrix showing how dashboard tools compare across mobile app quality, benchmark data, customization, ease of use, and AI features
| Feature | Databox | MetricNexus | Looker Studio | Klipfolio | Geckoboard | Cyfe | Whatagraph | AgencyAnalytics |
|---|---|---|---|---|---|---|---|---|
| Mobile App | ✓ Best-in-class | ✗ Web only | ✗ Web only | ✓ Good | ✓ Good | ✓ Basic | ✗ No | ✓ Good |
| TV Mode | ✓ Excellent | ✓ Basic | ✗ No | ✓ Good | ✓ Excellent | ✓ Good | ✗ No | ✓ Good |
| Benchmark Data | ✓ Excellent | ✓ Basic (SMB) | ✗ No | ✗ No | ✗ No | ✗ No | ✗ No | ✗ No |
| Custom Calculations | ✓ Good | ✓ Good | ✓ Excellent | ✓ Excellent | ✓ Good | ✓ Basic | ✓ Good | ✓ Good |
| White Label | ✗ No | ✗ No | ✗ No | ✗ No | ✗ No | ✗ No | ✓ Excellent | ✓ Good |
| Alerts/Notifications | ✓ Yes | ✓ Yes | ✗ No | ✓ Yes | ✓ Yes | ✓ Basic | ✓ Yes | ✓ Yes |
| Goal Tracking | ✓ Excellent | ✓ Basic | ✓ Basic | ✓ Basic | ✗ No | ✗ No | ✗ No | ✗ No |
| AI/NL Queries | ✗ No | ✓ Yes | ✗ No | ✗ No | ✗ No | ✗ No | ✗ No | ✗ No |
| Raw Data Export | ✓ Limited | ✓ Yes | ✓ Yes | ✓ Yes | ✓ Yes | ✓ Limited | ✓ Yes | ✓ Limited |
| Data Connectors | 300+ | 150+ | 700+ | 600+ | 100+ | 100+ | 200+ | 150+ |
| Free Tier | ✗ (14-day trial) | ✗ (14-day trial) | ✓ Unlimited | ✗ No | ✗ (14-day trial) | ✓ Partially | ✗ (7-day trial) | ✗ (7-day trial) |
Benchmark Data: Databox's Sustainable Advantage
Databox's benchmark data is genuinely hard to replicate. The platform aggregates anonymized KPI data from thousands of connected dashboards, allowing you to compare your metrics against industry peers.
The honest truth: no alternative truly matches this feature.
Databox's benchmarks work because they're built on a network effect—the more dashboards connected, the more valuable the benchmark groups. It's a moat that's difficult for competitors to build without equivalent scale.
However, there are alternatives:
-
Public benchmark reports: Industry organizations (HubSpot, Sprout Social, Hootsuite, etc.) publish annual benchmark reports free or cheap. These aren't real-time, but they're directionally accurate.
-
Third-party benchmark services: Platforms like Supermetrics and Contentsquare publish their own benchmarks.
-
SMB marketing benchmarks: If you're a small business, specific industry reports may be more relevant than Databox's broad categories.
-
Custom benchmarking: Export historical data and create your own benchmarks by comparing yourself against public competitor disclosures or industry averages.
If benchmark data is critical to your decision-making, Databox may remain the best choice despite its costs. But if benchmarks are nice-to-have rather than essential, the alternatives offer superior features and flexibility.
Pricing Comparison (2026)
Here's detailed pricing across all platforms:
| Tool | Tier | Monthly Cost | Users Included | Best For |
|---|---|---|---|---|
| Databox | Team | $295 | 1 user | Solo users |
| Business | $895 | 3 users | Small teams | |
| Enterprise | Custom | Unlimited | Large organizations | |
| MetricNexus | Starter | $49 | 1 account | Solo marketers |
| Growth | $129 | 3 accounts | Small teams | |
| Professional | $199 | Unlimited | Scaling teams | |
| Google Looker Studio | Free | $0 | Unlimited | Everyone |
| Klipfolio | Starter | $125 | 1 user | Individual analysts |
| Professional | $250 | 3 users | Team dashboards | |
| Enterprise | $500+ | Unlimited | Large organizations | |
| Geckoboard | Starter | $39 | 1 user | Individuals |
| Growth | $59 | 3 users | Small teams | |
| Pro | $99 | Unlimited | Larger teams | |
| Cyfe | Starter | $19 | 1 account | Solo users |
| Growth | $49 | Unlimited | Small teams | |
| Pro | $99 | Unlimited | Agencies | |
| Whatagraph | Agency | $199 | Unlimited clients | Agencies (minimum) |
| Enterprise | $499+ | Custom | Large agencies | |
| AgencyAnalytics | Starter | $79 | 3 clients | Small agencies |
| Growth | $159 | 10 clients | Growing agencies | |
| Pro | $249 | 20 clients | Established agencies |
Cost analysis: For a team of three users, Databox costs $895/month. You could use Geckoboard ($59/month × 3 = $177), Google Looker Studio (free), and MetricNexus ($129/month) for a combined $306/month—a 66% savings with complementary strengths.
Total cost of ownership: Monthly subscription fees tell only part of the story. Factor in setup time (Geckoboard: 15 minutes per dashboard vs. Klipfolio: 30+ minutes), training requirements, and ongoing maintenance. A tool that costs 20% more but saves 10 hours of setup time per month may deliver better ROI.
Mobile Experience Comparison
Since mobile access is a primary reason some teams stay with Databox, let's evaluate this carefully.
Databox Mobile: Best-in-class native app. Real-time updates, smooth animations, excellent touch interface. Designed for power users who live on their phones.
Geckoboard Mobile: Good native app. Slightly less polished than Databox, but adequate for most teams. Real-time updates work well.
AgencyAnalytics Mobile: Solid native app focused on client dashboards. Good for viewing, less good for configuration on mobile.
Whatagraph: No mobile app—web only. Not ideal if you need phone access.
Cyfe Mobile: Basic mobile app. Works, but interface feels dated.
Klipfolio Mobile: Mobile app available but not a primary focus. More powerful on desktop.
Google Looker Studio Mobile: Web-responsive only. Works on phones but not optimized.
MetricNexus Mobile: Web-responsive design. Works on mobile but designed primarily for desktop exploration.
Question to ask yourself: How much of your dashboard viewing actually happens on mobile? For most teams, it's less than 10%. If mobile access is genuinely critical to your workflow, Databox or Geckoboard remain the top choices. If it's occasional, web-responsive alternatives are sufficient.
Decision Framework: Choose Your Path
Different teams have different priorities. Here's how to choose:
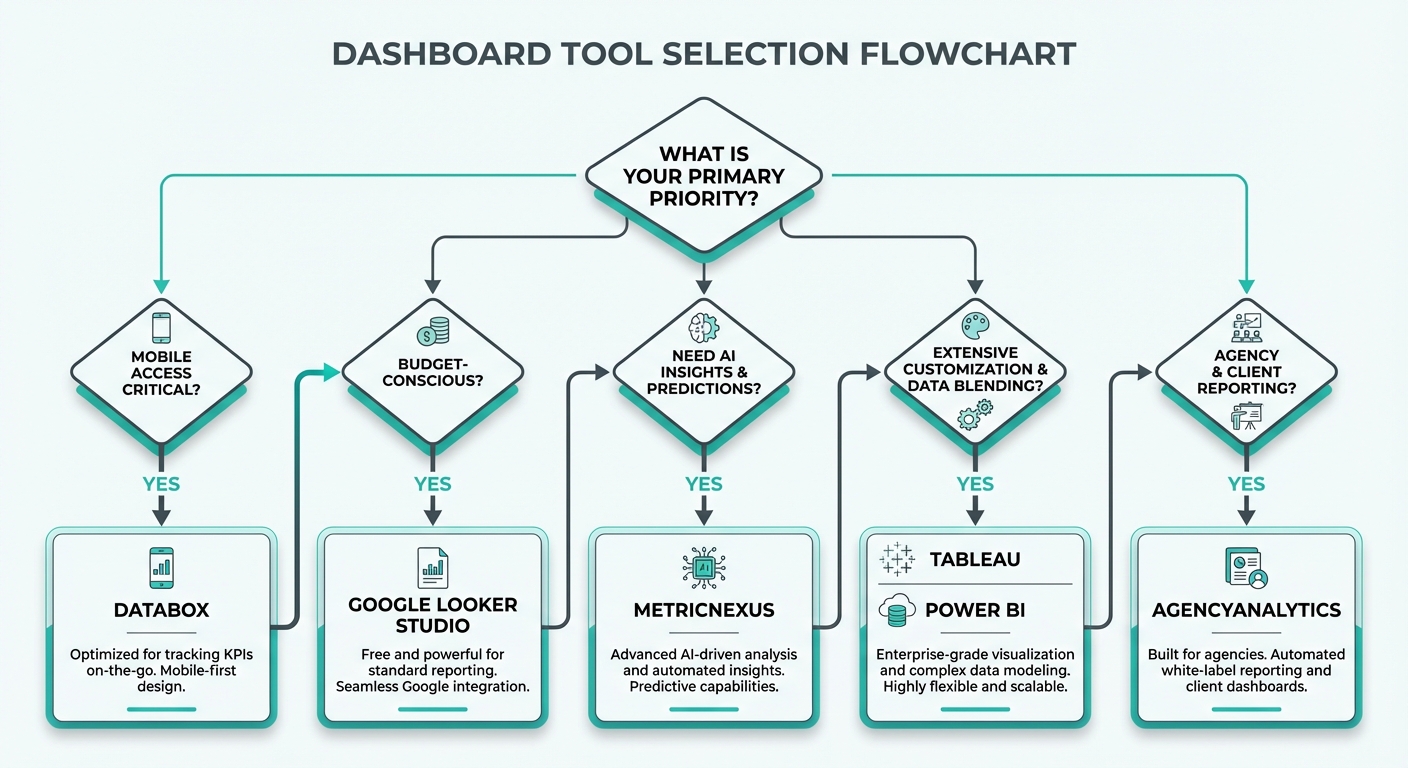 Decision tree for selecting dashboard tools based on priorities: mobile access, budget, AI insights, customization, and agency use
"I need the absolute best mobile experience"
→ Stay with Databox or try Geckoboard
If your team is constantly checking dashboards on mobile, these are your only real options with native apps designed for phone use.
"I need industry benchmark data"
→ Databox is hard to replace
Benchmark data remains Databox's strongest moat. If comparing against competitors is essential, you may need to stay or supplement with manual benchmarking.
"I need maximum flexibility and control"
→ Google Looker Studio or Klipfolio
If you need to build exactly what you imagine, without constraint, these tools deliver. Looker Studio for cost, Klipfolio for features.
"I need AI-powered insights and natural language queries"
→ MetricNexus
If you want to ask questions about your data instead of configuring dashboards, MetricNexus is purpose-built for this.
"I'm a marketing agency managing client dashboards"
→ AgencyAnalytics or Whatagraph
Whatagraph for report-heavy workflows, AgencyAnalytics for dashboard-heavy workflows. Both support white-label and multi-client management.
"I need the cheapest solution possible"
→ Google Looker Studio (free) or Cyfe ($19/mo)
Looker Studio is unbeatable for cost if you can work within Google's ecosystem. Cyfe is the cheapest paid option.
"I'm a small team that wants simplicity"
→ Geckoboard
Clean interface, beautiful dashboards, good support, reasonable pricing. No learning curve, just works.
Migration Tips: Moving From Databox
If you decide to switch, here's how to do it smoothly:
Step 1: Document everything
- Export current dashboard configurations (screenshot each dashboard)
- List all data sources and their account credentials
- Document custom metrics and calculations
- Note any alerts or goals you're tracking
Step 2: Prioritize your dashboards
- Identify which 3-5 dashboards are most critical
- These should be rebuilt first in the new tool
- Secondary dashboards can wait or be simplified
Step 3: Plan for benchmark data loss
- If Databox benchmarks are important, note which metrics you relied on
- Research alternative benchmark sources before migration
- Download any benchmark reports you may need as reference
Step 4: Set up side-by-side
- Don't shut down Databox immediately
- Run both tools in parallel for 2-4 weeks
- Verify new dashboards are accurate before decommissioning old ones
- This prevents data gaps during transition
Step 5: Train your team
- Brief team members on the new tool
- Walk through new dashboard locations and how to navigate
- Highlight any features that work differently
Step 6: Archive historical data
- Download historical dashboard snapshots from Databox if you need them
- Consider how you'll track metrics before the migration
When to Stay with Databox
Let's be fair: Databox remains an excellent choice for many teams.
Stay with Databox if:
-
Mobile-first workflows: Your team literally lives on mobile dashboards. Databox's app is genuinely best-in-class.
-
Benchmark data is critical: You make strategic decisions based on comparing against competitors. No alternative matches Databox's benchmark network.
-
Goal tracking is central: You use Databox's built-in goal tracking extensively and haven't found equivalent features elsewhere.
-
Team is already trained: You've invested time learning Databox. Switching costs (training, rebuilding dashboards, staff time) may exceed savings.
-
Budget is flexible: If $895/month doesn't hurt your budget, Databox's stability, support, and features justify the cost.
-
You need lead capture: If you integrate Databox dashboards into sales/marketing workflows with lead capture forms.
Migration is only worth it if you're actively hitting pain points. If Databox is working for your team and your budget supports it, there's no compelling reason to switch.
FAQ
Is Databox free? No, Databox doesn't offer a free tier—only a 14-day free trial. For a free alternative, try Google Looker Studio, which is genuinely unlimited and feature-rich.
What's the best free Databox alternative? Google Looker Studio is the clear winner. It's completely free, integrates with Google marketing tools, and is surprisingly powerful for building dashboards. The trade-off is no mobile app and a steeper learning curve.
How does Databox compare to Looker Studio? Databox offers better mobile apps, benchmark data, and pre-designed templates. Looker Studio is free, more flexible for custom calculations, and integrates deeper with Google products. Choose Databox for mobile-first teams and pre-built aesthetics. Choose Looker Studio for flexibility and budget.
Does Databox have competitors with benchmark data? Not really. Databox's benchmark network is its strongest differentiator. Some competitors publish industry benchmarks, but nothing matches the real-time, role-specific benchmarks Databox offers. If benchmarks are non-negotiable, you may need to stick with Databox.
Can I use multiple tools together? Yes. Many teams use Google Looker Studio for detailed analysis and Geckoboard for team dashboards, for example. There's no rule against combining tools—in fact, a stack of specialized tools often beats one "all-in-one" solution.
How long does migration take? Simple migrations (2-5 dashboards) take 1-2 weeks. Complex migrations (20+ custom dashboards) take 4-8 weeks. Factor in testing, team training, and running both tools in parallel.
G2 Ratings Overview (2026)
User reviews on G2 reflect real-world experience with these tools:
| Tool | G2 Rating | Reviews | Strongest Category |
|---|---|---|---|
| Databox | 4.4/5 | 800+ | Mobile app, benchmarks |
| Klipfolio | 4.5/5 | 500+ | Customization depth |
| Geckoboard | 4.4/5 | 200+ | Ease of use |
| AgencyAnalytics | 4.7/5 | 400+ | Agency features |
| Whatagraph | 4.5/5 | 300+ | Report design |
| Cyfe | 4.2/5 | 100+ | Budget value |
Common praise across platforms: clean interfaces, good integrations, responsive support. Common complaints: learning curves for advanced features, pricing complexity, and connector limitations for niche data sources.
Bottom Line
Databox remains an excellent KPI dashboard tool with genuinely best-in-class mobile experience and unique benchmark data. But it's far from your only option—and for many teams, alternatives offer better value, flexibility, or feature sets.
Here's the summary:
- For budget: Google Looker Studio (free) or Cyfe ($19/mo)
- For mobile: Databox or Geckoboard
- For AI/flexibility: MetricNexus
- For maximum customization: Klipfolio
- For agencies: AgencyAnalytics or Whatagraph
- For simplicity: Geckoboard
The right choice depends on your specific needs. If mobile and benchmarks are essential, Databox remains compelling despite its premium pricing. If you prioritize flexibility, budget, or AI-powered insights, alternatives likely offer better fit.
Start with a 14-30 day trial of your top two choices. Build 2-3 test dashboards in each. Involve your team in the evaluation. The best tool is the one your team will actually use consistently—and that often means the one with the least friction and best user experience, not necessarily the most features.
Related Posts

Supermetrics Alternatives: Best Options for Small Businesses (2026)
Looking for a Supermetrics alternative? We compare 8 marketing data tools with pricing, features, and recommendations for small businesses.

How to Build a Marketing Dashboard in Looker Studio (2026)
Complete guide to building a marketing dashboard in Looker Studio. Connect multiple data sources and create professional reports.

SMB Marketing Benchmarks 2026: What 'Good' Actually Looks Like
Marketing benchmarks specifically for small businesses. Real data on ROAS, CAC, conversion rates, and more - not enterprise metrics.
Ready to see your marketing data?
Start your free trial today. See your data in 5 minutes.
Start Free Trial