How to Connect LinkedIn Ads to Google Sheets
Automate your LinkedIn Ads reporting with Google Sheets. Step-by-step guide for B2B marketers with free template included.
MetricNexus Team

LinkedIn Ads is the platform for B2B marketing, but its reporting interface leaves something to be desired. Decision makers are scrolling through campaigns at their desks, not in their feeds. You need leads, not impressions. And you need reporting that connects those leads back to your sales pipeline.
The problem: LinkedIn's native reporting interface is clunky for analysis. The data lives in Campaign Manager, insights are hidden behind multiple clicks, and pulling historical trends or comparing performance across campaigns requires manual work. For B2B marketing teams tracking cost per qualified lead and pipeline influence, that friction compounds quickly.
The solution: Connect LinkedIn Ads to Google Sheets. With automated reporting, you get your data where your team actually works—in a spreadsheet they can query, chart, and share with sales leadership. You can combine lead form data with CRM records to calculate true ROI. You can build dashboards that show not just spend, but the qualified leads and pipeline value that spend generated.
In this guide, we'll cover four methods to get LinkedIn Ads data into Google Sheets, from fully automated integrations to manual exports. We'll also walk you through the B2B metrics that actually matter and how to build reports that executives will act on.
Why LinkedIn Ads + Google Sheets?
LinkedIn Ads targeting is unmatched for B2B. You can reach decision makers by job title, company industry, seniority, and even skills. But without proper reporting infrastructure, that precision targeting doesn't translate to insight.
Here's why B2B teams connect LinkedIn Ads to Google Sheets:
Combine with CRM data. Lead forms capture names and titles, but they're disconnected from your CRM. By syncing LinkedIn lead form data to Sheets alongside CRM records, you can track which leads became marketing-qualified leads (MQLs), which became sales-qualified leads (SQLs), and ultimately which closed. That's the path to calculating true return on ad spend.
Calculate cost per qualified lead. Raw cost per lead metrics are misleading. A $45 cost per lead sounds great until sales tells you 80% are unqualified. Combining LinkedIn data with CRM pipeline stages lets you calculate cost per SQL or cost per opportunity—metrics that matter for budget allocation.
Share with sales. Sales teams don't log into Campaign Manager. They check email and Slack. A weekly Google Sheets report showing leads generated, lead quality, and sales response rates keeps marketing and sales aligned.
Track pipeline influence. LinkedIn Ads often work long-cycle. A prospect might see your ad in January but not convert until April. By syncing lead dates to your CRM and tracking when they progress through the funnel, you can measure LinkedIn's true influence on revenue, not just immediate conversions.
Build executive reports. Leadership wants to know: Are we spending the budget effectively? Which campaigns are driving qualified leads? What's our cost per pipeline dollar influenced? Google Sheets lets you build dashboards that answer these questions and update automatically.
LinkedIn Ads Data Overview
Before connecting to Sheets, it's helpful to understand what data LinkedIn Ads makes available.
Campaign Metrics
The foundational metrics come from your campaigns:
- Impressions & Reach: How many LinkedIn members saw your ads and how many unique members
- Clicks: Total clicks to your landing page or lead form
- Click-Through Rate (CTR): Clicks divided by impressions—the engagement indicator
- Spend: Total budget spent
- Cost Per Click (CPC): Average cost for each click
- Cost Per Mille (CPM): Cost per 1,000 impressions—useful for comparing awareness campaigns
- Social Actions: Likes, comments, shares on your ads (small signal, but indicates engagement)
Conversion Metrics
If you've set up conversion tracking, you get higher-funnel visibility:
- Lead Form Fills: Number of LinkedIn members who filled out your sponsored lead form
- Lead Form Completion Rate: Percentage of visitors who completed the form
- Website Conversions: Tracked via LinkedIn Insight Tag pixel
- Cost Per Lead: Total spend divided by conversions
- Video Views: If running video ads, total views and completion rates
Audience Insights
LinkedIn's audience breakdown shows who's engaging:
- By Industry: Which sectors are clicking your ads
- By Job Function: Sales, Marketing, Engineering—which departments respond
- By Seniority: C-level vs. managers vs. individual contributors
- By Company Size: Fortune 500 companies vs. startups
- By Seniority Level: Entry-level, mid-level, senior, executive
Note: Some audience data requires Campaign Manager access and the ability to create custom reports. Basic advertisers see aggregated metrics only.
Method 1: Using an Automated Integration
For most B2B marketing teams, an automated integration is the best option. It eliminates manual work and ensures your Google Sheets is always current.
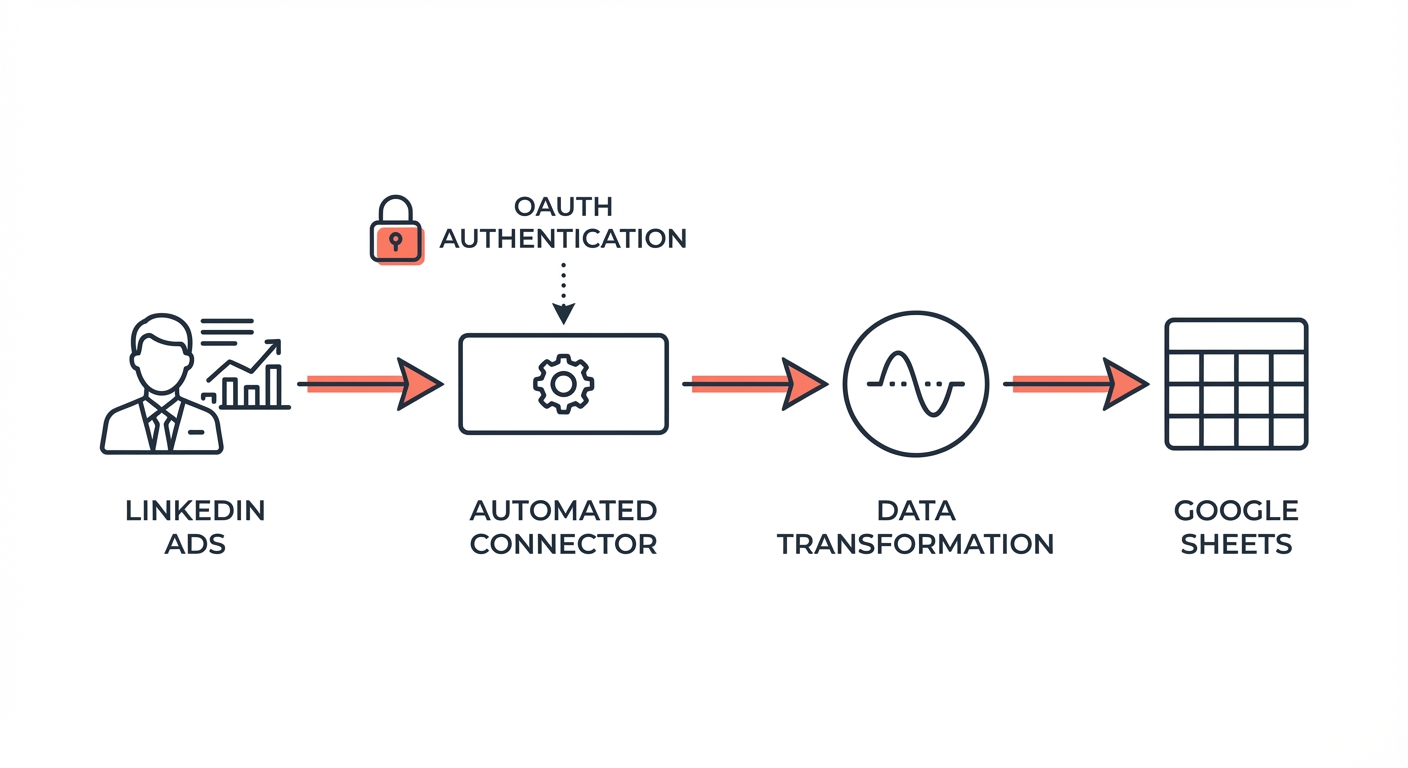 LinkedIn Ads to Google Sheets data flow showing OAuth authentication and data transformation steps
Step 1: Connect Your LinkedIn Account
Start by granting permission to the integration tool. Most integrations (including MetricNexus) use OAuth, so you'll sign in to LinkedIn directly—no API keys to manage.
[Screenshot: OAuth prompt asking for "Allow this app to access your LinkedIn Ads account"]
Click "Authorize" and select which LinkedIn ad account(s) you want to connect. If you manage multiple brands or accounts, you can select all of them at once.
Step 2: Choose Your Metrics
Next, select which campaigns and metrics you want to sync. Most integrations let you:
- Choose specific campaigns or sync all campaigns
- Select individual metrics (impressions, clicks, spend, conversions, etc.)
- Set a date range (last 30 days, custom range, all time)
- Group data by day, week, month, or campaign
For a B2B marketing team, we recommend starting with:
- Impressions, Clicks, CTR, Spend, CPC
- Lead Form Fills (if using LinkedIn lead forms)
- Cost Per Lead
- Breakdown by campaign and date
[Screenshot: Integration interface showing checkboxes for metrics selection]
Step 3: Connect to Google Sheets
Most integrations let you select an existing Google Sheets file or create a new one. Pick a name like "LinkedIn Ads Reporting" and choose whether to append data to an existing sheet or create a new tab for each campaign.
For automated syncing to work smoothly, use a dedicated Sheets file (not the team's shared "Random Stuff" spreadsheet). This prevents accidental deletions and makes permissions easier to manage.
[Screenshot: Google Sheets connection dialog with file selection dropdown]
Step 4: Set Up Automated Syncing
The final step is choosing your sync schedule. Most integrations offer:
- Daily: Data updates every morning (good for active campaigns)
- Weekly: Updates every Monday (sufficient for most teams)
- Monthly: Updates once a month (good for historical analysis)
We recommend daily syncing for active campaigns and weekly for paused campaigns. Daily updates mean sales can see the latest lead form results without refreshing Campaign Manager.
Once configured, your data will sync automatically. You can view historical data and set up the dashboard steps below.
Method 2: Using Supermetrics
If you prefer an established data integration platform, Supermetrics is a popular alternative with deep B2B credentials.
Supermetrics is a Google Workspace add-on that connects dozens of marketing platforms to Google Sheets. For LinkedIn Ads, it offers:
- Direct Campaign Manager integration
- Breakdown by campaign, creative, audience segments
- Support for custom date ranges and historical data
- Ability to build formulas in Sheets that refresh data on demand
Setup Process:
- Install Supermetrics from the Google Workspace Marketplace
- In Google Sheets, go to Extensions → Supermetrics → Launch
- Select "LinkedIn Ads" as your data source
- Choose your LinkedIn ad account and campaigns
- Configure metrics and date ranges
- Select which sheet and cells to populate
- Set up a refresh schedule
Supermetrics is particularly useful if you're already pulling data from Google Ads, Meta Ads, and other channels into the same Sheets file. You get a unified interface for all platforms.
Pricing: Supermetrics offers a free tier for limited queries, with paid plans starting around $99/month for unlimited syncs.
Method 3: Using Coupler.io
Coupler.io is a lightweight automation tool that connects data sources to Google Sheets via a simple visual interface.
Setup:
- Sign up at coupler.io
- Create a new automation
- Select LinkedIn Ads as your source
- Connect your LinkedIn account via OAuth
- Choose campaigns and metrics
- Select your destination Google Sheets
- Set up a sync schedule
Coupler.io is straightforward and good for teams already using it for other data sources. The main limitation is that LinkedIn support is in their premium tier (around $20-50/month depending on sync frequency).
Method Comparison
Which method is right for your team? Here's a quick comparison:
| Method | Setup Time | Cost | Best For |
|---|---|---|---|
| Automated Integration | 5-10 minutes | $20-100/month | Teams wanting hands-off daily reporting |
| Supermetrics | 10-15 minutes | $99+/month | Multi-channel reporting (Google Ads + Meta + LinkedIn in one sheet) |
| Coupler.io | 10-15 minutes | $32-132/month | Teams already using Coupler for other data sources |
| Manual CSV Export | 5 minutes per export | Free | One-time audits or teams with strict data policies |
| Google Apps Script | 1-2 hours (requires coding) | Free | Engineering-resourced teams wanting full control |
If you need data from LinkedIn Ads only, a lightweight integration or Coupler.io will do. If you're pulling from multiple ad platforms into one sheet, Supermetrics or a multi-source tool is worth the cost.
Method 4: LinkedIn Ads Export (Manual)
If you prefer not to use a third-party integration (understandable for data security reasons), you can export LinkedIn Ads data manually and import it to Sheets.
Export from Campaign Manager:
- Log into Campaign Manager (linkedin.com/campaignmanager)
- Go to the Campaigns or Analytics tab
- Select the date range you want to export
- Choose the campaigns or ads to include
- Click "Export" and select CSV format
- Download the file
[Screenshot: Campaign Manager export dialog with CSV option selected]
Import to Google Sheets:
- Open your Google Sheets file
- Go to File → Import → Upload
- Select your LinkedIn Ads CSV file
- Choose to "Insert new sheet(s)" or append to existing data
- Click Import
Limitations: Manual export is simple but not scalable. You have to remember to export weekly, manually paste data, and you can't easily compare trends across months. We only recommend this method for:
- One-time audits of historical data
- Teams with very small monthly budgets
- Companies with strict data integration policies that prevent OAuth connections
For ongoing reporting, automated methods save hours each month.
Free LinkedIn Ads Template
We've built a free Google Sheets template designed specifically for B2B teams connecting LinkedIn Ads. The template includes:
Campaign Performance Dashboard
A one-page overview showing:
- Total spend this month vs. last month
- Leads generated (with trend indicator)
- Cost per lead over time
- Top 5 performing campaigns by CTR and cost per lead
- Campaign status (active, paused, completed)
This tab is designed to be shared with sales leadership. You can glance at it in 30 seconds and know how the month is tracking.
[Screenshot: Dashboard with cards showing spend, leads, cost per lead, and campaign status]
Lead Form Analysis
A detailed tab for campaigns using LinkedIn lead forms:
- Lead form fills by day and campaign
- Lead form completion rate
- Cost per lead form fill
- Form field response breakdown (if available)
- Week-over-week comparison
This helps you optimize which form questions you're asking and identifies when certain campaigns are driving higher-quality responses.
Cost Per Lead Tracking
A metrics table with:
- Target cost per lead (your goal)
- Actual cost per lead by campaign
- Variance from target
- Confidence level (did we get enough conversions to trust this number?)
This is the sheet you use for budget allocation decisions. Campaigns performing above target get paused or retargeted; campaigns below target get increased budget.
Week-Over-Week Trends
A historical view showing:
- Weekly spend, leads, and cost per lead
- Whether metrics are improving or declining
- Seasonality notes (e.g., "Leads always drop in August")
This tab reveals patterns. Maybe your cost per lead is 20% higher on Mondays. Maybe leads drop during vacation seasons. These insights drive better campaign scheduling.
Executive Summary View
A one-slide summary with:
- Total spend and leads for the period
- Cost per lead and comparison to goal
- Sales acceptance rate (if connecting to CRM)
- Pipeline value influenced
- Key wins and recommended actions
This is the deck you print/screenshot and attach to an email to your CFO.
You can download the template, make a copy, and plug in your LinkedIn Ads data. All charts and metrics auto-populate.
Key LinkedIn Ads Metrics to Track
Not all metrics matter equally for B2B marketers. Here's what to focus on.
Top-of-Funnel Metrics
These show reach and awareness:
- Impressions: How many times your ads appeared. Useful for awareness campaigns or targeting analysis.
- Reach: How many unique LinkedIn members saw your ads. More meaningful than impressions for brand awareness.
- Frequency: Average number of times each person saw your ad. If frequency is 5+, you might be over-serving and wasting budget.
Top-of-funnel metrics matter most for thought leadership campaigns and campaigns targeting new markets. For lead generation, focus on the metrics below.
Engagement Metrics
- Clicks: The primary action for most campaigns. Every click represents someone interested enough to visit your site.
- Click-Through Rate (CTR): Your ad's engagement rate. LinkedIn average CTR is 0.4-0.6% for most industries. Below 0.3% suggests your creative or targeting needs refinement.
- Cost Per Click (CPC): How much you're paying per click. B2B averages are $5-8, but can range from $2-15 depending on industry and targeting specificity. Tech and finance are more expensive; manufacturing often cheaper.
- Engagement Rate: Likes, comments, and shares as a percentage of impressions. Typically 0.1-0.5% for B2B. Higher engagement can indicate resonant messaging but doesn't always correlate with conversions.
- Social Actions: Comments and shares. These are rare but valuable—they indicate your message resonated enough for someone to share with their network.
Conversion Metrics
Where leads come from:
- Lead Form Fills: If using LinkedIn lead forms, this is your primary conversion metric. Forms are faster than landing pages and have higher completion rates.
- Lead Form Completion Rate: Percentage of people who clicked your ad and completed the form. Target is 20-40%. Below 10% suggests form friction.
- Website Conversions: Tracked via the LinkedIn Insight Tag pixel. These are conversions on your site (signup, demo request, whitepaper download, etc.).
- Cost Per Lead: Total spend divided by conversions. This is your primary budget lever. B2B ranges widely: $30-200 depending on offer and targeting. A $50 cost per lead is good for most B2B; above $100 suggests you need to optimize.
- Conversion Rate: Percentage of clicks that convert. B2B conversion rates are typically 2-8% depending on offer and targeting quality.
Quality Metrics (Requires CRM Connection)
These are the game-changers for B2B reporting:
- Sales-Qualified Lead Rate: Percentage of LinkedIn leads that sales marked as qualified. If your cost per lead is $50 but only 30% are qualified, your true cost per qualified lead is $167.
- Cost Per Qualified Lead: Total spend divided by sales-qualified leads. This is the metric that drives budget allocation.
- Lead Response Time: How quickly sales contacted the lead. LinkedIn leads often time-decay; a $50 lead that sales reaches in 5 minutes is better than a $40 lead reached after 2 days.
- Pipeline Value Influenced: Total pipeline value (opportunity size) influenced by LinkedIn leads. A $50 cost per lead is excellent if it influences $10,000 in pipeline.
- Win Rate: Percentage of SQL leads that closed. This reveals the true quality difference between campaigns.
You won't have data for quality metrics on day one. That requires integrating your CRM with your reporting (we'll cover that below). But start tracking cost per lead immediately. As those leads age in your CRM over the next 30-90 days, you'll be able to layer in quality metrics.
LinkedIn Ads Benchmarks
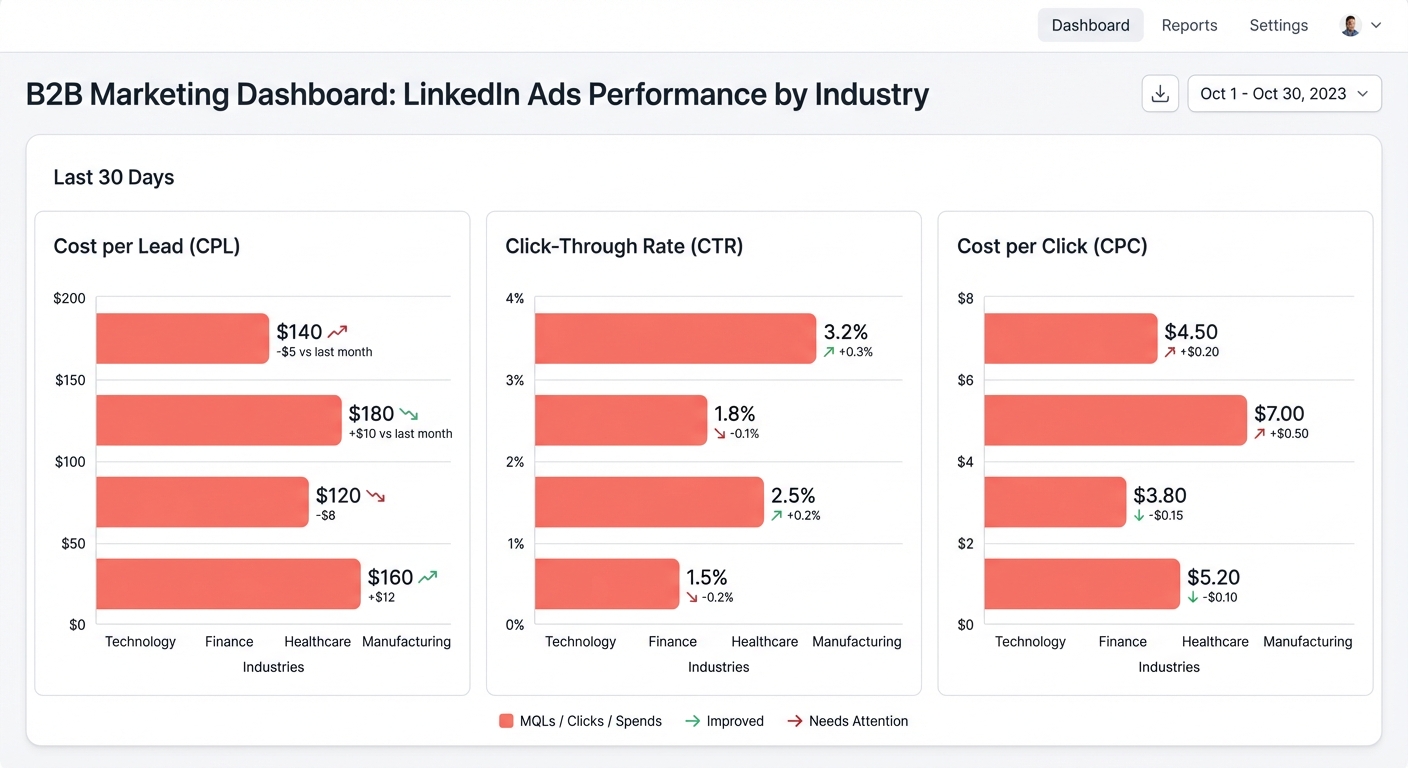 B2B marketing dashboard showing LinkedIn Ads performance metrics by industry
What's a good result? Here's how to benchmark your campaigns against industry standards.
Click-Through Rate (CTR)
LinkedIn Ads average CTR is 0.4-0.6% across most industries. Here's how to evaluate:
| Performance | CTR | What It Means |
|---|---|---|
| Below Average | <0.3% | Creative is not resonating or targeting is too broad. Test new headlines, images, or refine audience. |
| Average | 0.4-0.6% | You're on par with the platform average. Solid baseline. |
| Good | 0.7-1.0% | Strong creative or very targeted audience. This will drive lower cost per conversion. |
| Excellent | >1.0% | Your message and targeting are aligned. Keep this creative and expand to similar audiences. |
Benchmarks by Ad Format
Performance varies significantly by ad format. These numbers reflect 2025-2026 data across B2B campaigns:
| Ad Format | Avg CTR | Avg CPC | Best Use |
|---|---|---|---|
| Single Image | 0.40-0.56% | $3-7 | Lead generation, whitepaper offers |
| Carousel | 0.40-0.50% | $2-5 | Product features, multi-step storytelling |
| Video | 0.20-0.44% | $6-18 | Brand awareness, thought leadership |
| Message/InMail | 3.0-3.6% CTR (38% open rate) | N/A (CPM-based) | Direct outreach, event invitations |
| Conversation Ads | 12% CTR (50% open rate) | N/A (CPM-based) | Multi-path engagement, webinar signups |
Message and Conversation Ads operate on a different model (cost per send, not cost per click), so direct CPC comparison isn't meaningful. But their engagement rates are dramatically higher than feed-based formats. Video ads have lower CTR but completion rates average 29.5%, making them effective for retargeting audiences.
Cost Per Click (CPC)
The global average LinkedIn CPC is $5.58, with U.S. averages running higher at $8-10. CPC varies by industry and targeting precision:
| Industry | Typical Range | Notes |
|---|---|---|
| Technology / SaaS | $8-15 | High competition for decision makers |
| Financial Services | $10-18 | Most expensive—CPAs, finance leaders |
| Manufacturing | $3-8 | Lower competition, still good targeting |
| Professional Services | $5-12 | Medium competition |
| B2B Marketing Tools | $6-12 | Competitive, many businesses buying |
| Healthcare | $4-7 | Moderate competition, growing B2B segment |
| Education | $3-5 | Lower competition than tech/finance |
Your CPC will be higher if you're targeting:
- C-level executives (highest demand)
- Rare job titles or skills
- Specific industries
- Geographic restrictions
If your CPC is above the range, test:
- Broadening your audience
- Adjusting bid strategy (lowest cost vs. target CPC)
- Refining your targeting to find cheaper sub-segments
Cost Per Lead
Cost per lead is where budget decisions happen. Here's the framework:
| Metric | Below Average | Average | Good | Excellent |
|---|---|---|---|---|
| Cost per Lead (forms) | >$80 | $50-80 | $30-50 | <$30 |
| Cost per Lead (website) | >$120 | $60-120 | $40-60 | <$40 |
| Lead Form Completion Rate | <15% | 20-30% | 35-50% | >50% |
The dramatic difference between form and website conversions is real—lead forms are optimized for completion (usually just name, email, company) while website forms often ask for 8-10 fields and have higher friction.
Cost Per Lead by Industry
CPL varies dramatically by vertical. These ranges reflect 2025-2026 benchmark data:
| Industry | CPL Range | Notes |
|---|---|---|
| Software & IT | $100-150 | High intent but competitive targeting |
| Financial Services | $80-125 | Expensive audience, high deal values justify it |
| Education | $50-75 | Lower competition, strong lead form performance |
| Healthcare | $100-150 | Regulated industry, smaller audience pools |
| Manufacturing | $75-120 | Niche targeting works well |
| Media & Communications | $50-80 | Broad audience, lower CPCs |
| Retail / Consumer Goods | $60-100 | B2B retail (suppliers, distributors) |
Regional variation matters too. North American campaigns average $230 CPL while APAC averages $80 and LATAM averages $60. If you're running global campaigns, segment your reporting by region to avoid misleading averages.
Lead Quality Metrics
Once you connect to your CRM:
| Metric | Target | How to Use |
|---|---|---|
| Sales-Qualified Lead Rate | 30-50% | If less than 20%, leads are too raw. Improve targeting or pre-qualify in lead form. |
| Cost per SQL | $150-300 | True comparison metric. Use this to benchmark against other channels. |
| Response Time to Lead | <2 hours | LinkedIn leads decay fast. Sales contact within 2 hours sees 5x better conversion. |
| Win Rate | 10-20% | Track closed deals from LinkedIn-originated leads. Use for attribution. |
These benchmarks assume you're targeting decision makers (the LinkedIn strength). If you're targeting general audiences or low-intent keywords, expect your performance to be weaker. If you're selling a small-ticket product with quick sales cycles, your CPL will be lower. If you're selling large enterprise contracts, your cost per lead will be higher but your deal sizes will justify it.
Combining LinkedIn Ads with CRM Data
This is where B2B reporting gets powerful. Connecting LinkedIn lead data with your CRM (Salesforce, HubSpot, Pipedrive, etc.) lets you track leads through their entire journey.
The Setup:
-
Export LinkedIn lead form data to your CRM automatically or in batch. Most CRMs have native LinkedIn lead sync or plugins to automate this.
-
Add a "source" field in your CRM to mark leads as coming from LinkedIn Ads. This is critical for attribution.
-
Track the lead through stages: New Lead → MQL (marketing qualifies) → SQL (sales qualifies) → Opportunity → Closed Won/Lost.
-
Build a formula in Google Sheets that sums pipeline value by lead source. Example:
- LinkedIn Ads drove 50 SQL leads this month
- 8 of those became opportunities (16% conversion)
- Total opportunity value: $400,000 (average deal size $50K)
- Cost per opportunity: $1,000 (total spend / opportunities)
Example Report:
Code block (markdown)Total LinkedIn Ad Spend: $10,000
Total Leads Generated: 200
Cost per Lead: $50

Leads that Became MQL: 80 (40% qualification rate)
Cost per MQL: $125

Leads that Became SQL: 30 (15% qualification rate)
Cost per SQL: $333

Leads that Became Opportunities: 5 (2.5% conversion to opportunity)
Cost per Opportunity: $2,000

Closed Won Deals from LinkedIn: 1
Cost per Closed Deal: $10,000
Total Revenue Influenced: $65,000
Return on Ad Spend: 6.5x
That single $10,000 month of spend influenced $65,000 in closed revenue. Now you have ROI numbers that justify your LinkedIn budget to leadership.
How to Set This Up:
Most CRMs support bulk imports or API sync from LinkedIn. Here's the typical flow:
- LinkedIn lead form fills → HubSpot/Salesforce (automatic or daily sync)
- Add "Source: LinkedIn Ads" tag to each lead
- Track that lead through your CRM stages
- In Google Sheets, pull CRM data (using integrations like Supermetrics or API calls) and join it with your LinkedIn Ads data by date and lead source
- Calculate conversion rates and revenue attribution by campaign
If you're using a tool like MetricNexus that supports CRM sync, this is handled automatically. Otherwise, you'll need to set up manual matching or use a tool like Zapier to sync CRM data to Sheets.
Building B2B Marketing Reports
Once your data is in Google Sheets, the real analysis begins. Here's how to structure reports for different audiences.
Executive Summary
This is a one-page snapshot for the CEO or CFO:
- Total LinkedIn Ads spend (YTD and this month)
- Leads generated and trending (up/down vs. last month)
- Cost per lead and if it's above or below target
- Cost per qualified lead (if CRM connected)
- Pipeline value influenced (if tracking through sales)
- Recommendation: Which campaigns are working, which need adjustment
This report should answer: "Is LinkedIn Ads delivering ROI?"
Campaign Performance
A detailed breakdown for the marketing team:
- Campaign name, status (active/paused), launch date
- Spend and CPM (cost per 1,000 impressions)
- Impressions, clicks, CTR, CPC
- Leads (if using forms) and cost per lead
- Week-over-week comparison and trend
- Notes on creative changes or audience adjustments
This is the sheet you use for weekly team syncs. It answers: "Which campaigns are winning? Where should we allocate more budget?"
Lead Quality & Sales Handoff
For teams with CRM integration:
- Leads by source campaign
- Leads by quality (MQL, SQL, by sales team rating)
- Response time to lead (when did sales contact?)
- Conversion rates by stage (lead → MQL → SQL → opportunity)
- Win rate by source campaign
- Average deal size influenced by campaign
This is the sheet you share with sales leadership. It answers: "Are these leads valuable? Is sales following up fast enough?"
Funnel Analysis
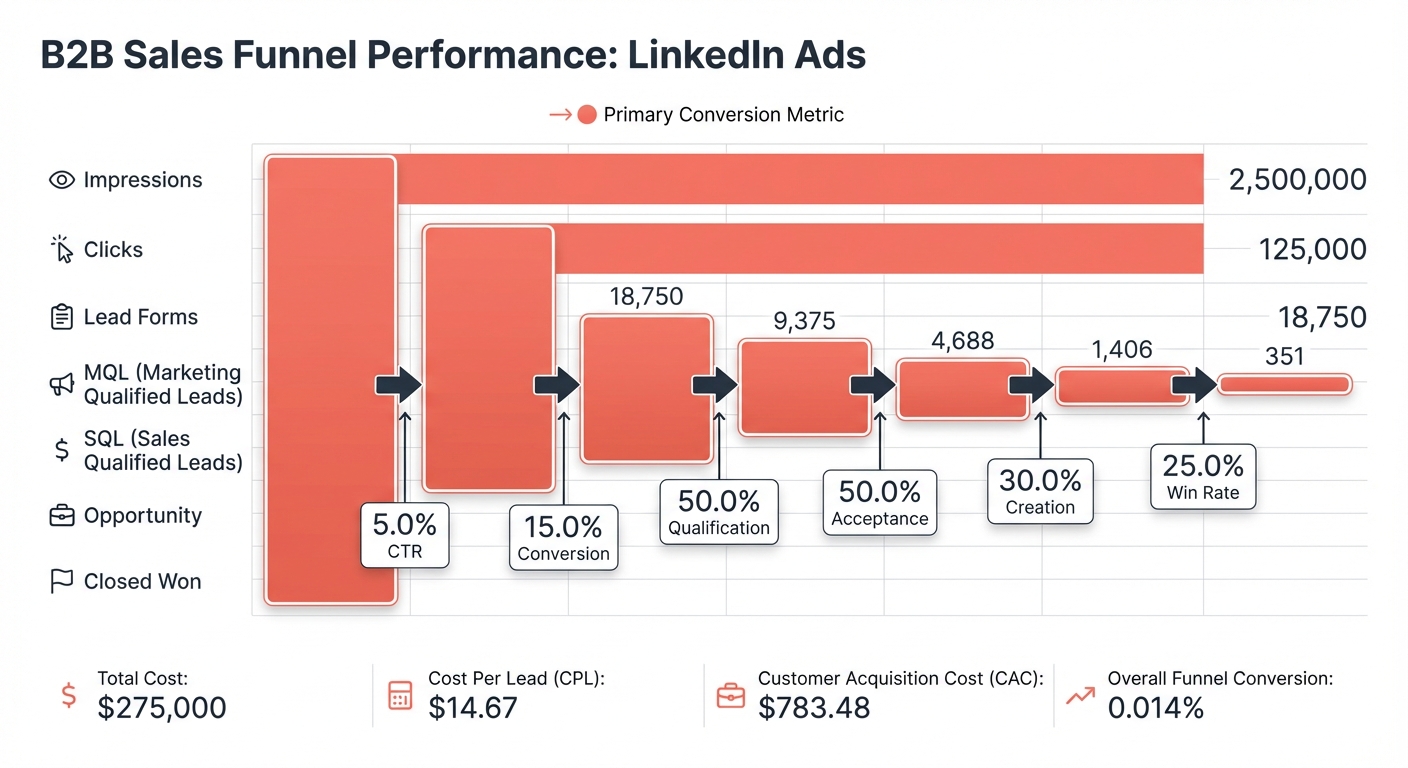 B2B sales funnel from LinkedIn Ads impressions to closed deals with conversion rates at each stage
A visual flow showing where leads drop off:
Code block (markdown)Starting LinkedIn Spend: $10,000
Impressions: 500,000
Clicks: 2,500 (0.5% CTR)
Lead Form Fills: 250 (10% of clicks)
MQL (Sales-Qualified): 80 (32% of leads)
SQL: 30 (38% of MQL)
Opportunity: 5 (17% of SQL)
Closed Won: 1 (20% of opportunities)
Revenue: $65,000
At each stage, you can see where you're losing people. If your click-to-lead conversion is only 5%, you need better landing pages. If only 20% of leads become MQL, you're targeting wrong. If sales isn't following up, SQL rates will suffer.
Common Issues & Solutions
When setting up LinkedIn Ads + Google Sheets integration, you might run into:
"I can't see all my ad accounts"
LinkedIn Ads has role-based permissions. If you don't see all accounts:
- Check that your LinkedIn user has Campaign Manager access on all accounts
- Verify you have "Account Owner" or "Campaign Manager" role (not "Administrator" alone)
- If sharing across team members, make sure each person has their own Campaign Manager access
- Some integrations require re-authorization if permissions change
"Conversion data is missing"
LinkedIn Insight Tag setup is required for website conversions. If you're not seeing conversion data:
- Install the LinkedIn Insight Tag on your website (one pixel per domain)
- Wait 24-48 hours for initial data to populate
- Verify the tag is firing (check your browser's Network tab when visiting your site)
- If using lead forms, conversion data comes from the form itself (doesn't require Insight Tag)
"Lead form data isn't syncing to Sheets"
Lead form data sometimes requires separate handling:
- Verify lead forms are being collected (check Campaign Manager → Lead Forms section)
- If using an integration, confirm the LinkedIn connector includes lead form data (not all do)
- Some integrations pull lead form fills as a metric but not individual lead data
- For individual lead data with contact info, you often need to export from Campaign Manager directly or use LinkedIn's API
"My metrics don't match Campaign Manager"
Different systems sometimes report different numbers. Common causes:
- Attribution windows: Campaign Manager might use 30-day click attribution, while your Sheets uses 7-day. Agree on a consistent attribution window.
- Timezone differences: Ensure your integration is using your company's timezone (not UTC).
- Partial days: If syncing mid-day, Campaign Manager might show complete days while your integration shows partial. Always compare same-day after midnight.
- Conversions lag: Website conversions tracked via Insight Tag can lag 24-48 hours. Compare 2-3 days back.
LinkedIn Conversions API and Offline Tracking
LinkedIn's Conversions API (CAPI) lets you send conversion events server-side, bypassing browser limitations. This matters for B2B reporting because:
- Offline conversions: Track when a LinkedIn lead becomes an SQL or closes a deal, even weeks later. Send the event back to LinkedIn for attribution.
- Browser tracking gaps: Ad blockers and iOS privacy changes block the Insight Tag for 20-30% of visitors. CAPI captures conversions that the pixel misses.
- Enhanced match rates: CAPI uses hashed email addresses to match conversions to LinkedIn members, improving attribution accuracy.
If you're using Google Sheets for reporting and your CRM for tracking leads, CAPI closes the loop by feeding closed-deal data back to LinkedIn's optimization algorithm. Campaigns get smarter about which audiences convert, not just which ones click.
Setup: CAPI requires a developer or a CRM integration that supports it (HubSpot and Salesforce both offer native LinkedIn CAPI connectors). The data flow is: CRM detects stage change (e.g., lead becomes SQL) -> sends event to LinkedIn CAPI -> LinkedIn attributes it to the original ad click.
LinkedIn Ads vs Other B2B Channels
LinkedIn is expensive. It's worth it, but only if you know why.
LinkedIn vs. Google Ads (B2B Search)
| Metric | Google Ads | |
|---|---|---|
| CPC | $5-15 | $2-8 |
| Lead Quality | High (targeting by job title/company) | Medium (targeting by keyword) |
| Best Use | Targeting decision makers | Capturing intent (people searching for solutions) |
| Time to Lead | 2-3 weeks average | 1-7 days (faster intent) |
| Audience Size | Limited (targeting specific roles) | Huge (any search intent) |
Use together: LinkedIn for brand-building with decision makers. Google Ads for capturing people actively searching for your solution.
LinkedIn vs. Meta Ads (Facebook/Instagram)
| Metric | Meta | |
|---|---|---|
| CPC | $5-15 | $0.50-3 |
| CPM | $31-38 | $1-5 |
| B2B Targeting | Excellent (job titles, companies) | Limited (lookalike audiences, interests) |
| Lead Quality | Higher | Lower (broad interest targeting) |
| Best Use | Reaching decision makers at work | Reaching people in personal context |
Budget allocation: For B2B, allocate 60-70% to LinkedIn, 20-30% to Google Ads, 10-20% to other channels. LinkedIn's higher costs are justified by better targeting.
LinkedIn vs. Content Syndication / Thought Leadership
Some B2B companies skip LinkedIn Ads entirely and build audience through content and thought leadership. Comparison:
- LinkedIn Ads: Faster results (weeks), higher CPL, paid reach
- Content + Thought Leadership: Slower results (months), organic reach, builds brand over time
Ideal strategy: Use LinkedIn Ads in months 1-3 to build initial lead flow while you're building organic thought leadership. Over time, organic reach grows and reliance on paid ads decreases.
Google Sheets Formulas for LinkedIn Ads
Once your data is in Google Sheets, these formulas help you calculate the metrics that matter.
Cost Per Lead (CPL):Code block (markdown)=SUM(Spend_Column)/SUM(Leads_Column)
Code block (markdown)=SUM(Clicks_Column)/SUM(Impressions_Column)*100
Code block (markdown)=SUM(Spend_Column)/COUNTIF(Status_Column,"SQL")
Code block (markdown)=(This_Week_CPL - Last_Week_CPL) / Last_Week_CPL * 100
Conditional Formatting for CPL Targets: Use conditional formatting to highlight campaigns above your target CPL in red and below in green. Select your CPL column, go to Format -> Conditional formatting, and set rules like "greater than 80" (red) and "less than 50" (green). This makes it immediately obvious which campaigns need attention during weekly reviews.
ARRAYFORMULA for Auto-Calculating New Rows:Code block (markdown)=ARRAYFORMULA(IF(A2:A<>"", B2:B/C2:C*100, ""))
This calculates CTR for every row automatically as new data syncs in, so you don't need to drag formulas down each time.
FAQ
Can I automate LinkedIn Ads to Google Sheets for free?
Partially. You can manually export and paste for free. For automated syncing without paying for an integration, you'd need to build a custom script using LinkedIn's API (requires engineering resources). For most teams, paying $20-100/month for an integration saves more time than it costs.
How do I export LinkedIn Ads data?
Log into Campaign Manager, select your date range and campaigns, and click "Export" → CSV. You can then import the CSV to Google Sheets. This is a one-time manual process.
What's a good cost per lead on LinkedIn?
Depends on your industry and offer. For most B2B SaaS, $30-80 per lead is good. For enterprise software, $100-200 is normal. For high-volume, low-ticket offers, $20-50. The real metric is cost per SQL (sales-qualified lead) or cost per closed deal.
Why is my LinkedIn CPL higher than my Google Ads CPL?
LinkedIn charges for impressions and clicks (not just conversions), so CPL is naturally higher. But LinkedIn leads are typically higher quality because you're targeting by job title and company, not just keyword intent. Compare cost per closed deal, not cost per lead.
Do I need CRM integration for reporting?
No, but it transforms your reporting. Without CRM data, you can track spend, clicks, and form fills. With CRM data, you can track actual lead quality, sales follow-up speed, and revenue influenced. Start simple (track CPL), then add CRM data as your process matures.
How often should I check my LinkedIn Ads performance?
For actively running campaigns: daily or weekly. For paused campaigns: monthly. Use Google Sheets for weekly trends, but also spot-check Campaign Manager daily for real-time optimization opportunities.
What LinkedIn Ads data can I pull into Google Sheets?
Most integrations support: ad analytics (impressions, clicks, spend, conversions), campaign metadata (names, status, budgets), campaign group data, creative performance, and video ad metrics. Some also support lead form submission data with individual contact details. The LinkedIn Marketing API provides breakdowns by campaign, creative, date, and audience demographics (industry, job function, seniority, company size).
Can I combine LinkedIn Ads data with other ad platforms in one sheet?
Yes. Tools like Supermetrics and Coupler.io support 100+ data sources. You can pull Google Ads, Meta Ads, and LinkedIn Ads into separate tabs in the same Google Sheets file, then build a summary tab with cross-channel comparisons. This is the most common setup for B2B teams running multi-channel campaigns.
Next Steps
-
Download the free LinkedIn Ads template and connect it to your LinkedIn account using one of the methods above (automated integration recommended for ongoing tracking).
-
Import 3 months of historical data to see trends. Most integrations let you backfill historical data on first setup.
-
Connect your CRM (Salesforce, HubSpot, Pipedrive) so you can track leads through the funnel. Even without custom fields, you can manually track cost per SQL using CRM data and Sheets formulas.
-
Build your first executive report showing total spend, leads, cost per lead, and a recommendation on one campaign that's performing well and one that needs optimization.
-
Share with sales leadership. A weekly Sheets report showing LinkedIn leads and response rates keeps teams aligned on lead quality and follow-up speed.
-
Connect other B2B channels (Google Ads, account-based marketing campaigns, content syndication) to the same Sheets file. Having all channels in one place makes budget allocation decisions easier.
Your LinkedIn Ads data is valuable—especially when combined with CRM insights and shared with the right people. Get it into Google Sheets and you'll have the reporting infrastructure to optimize spend, prove ROI, and scale what's working.
Related Posts

How to Connect Meta Ads to Google Sheets (5-Minute Setup)
Connect your Facebook and Instagram Ads data to Google Sheets automatically. Step-by-step guide with free template included.

How to Connect TikTok Ads to Google Sheets
Automatically sync your TikTok Ads data to Google Sheets. Step-by-step setup guide with free template for campaign reporting.

How to Build a Marketing Dashboard in Looker Studio (2026)
Complete guide to building a marketing dashboard in Looker Studio. Connect multiple data sources and create professional reports.
Ready to see your marketing data?
Start your free trial today. See your data in 5 minutes.
Start Free Trial