Marketing KPIs for Solopreneurs (What to Track When You're Solo)
Running a one-person business? Here are the only marketing metrics you need to track - and how to do it without drowning in data.
MetricNexus Team

Most marketing advice assumes you have a marketing team, analytics tools, and time to analyze data. Solopreneurs have none of that. You're juggling customer support, product development, sales, and maybe fulfillment—all while trying to grow. The last thing you need is a bloated analytics system that eats 10 hours a week.
Here's the truth: you don't need fancy marketing software or dozens of metrics. You need clarity on what's working, delivered in 15 minutes a week. This guide cuts through the noise and shows you exactly what to track.
The Solopreneur Marketing Reality
Let's be honest about your situation. You're wearing every hat. You make the product, you handle customer support, you do the sales calls, and somehow you're also supposed to have a "marketing strategy." When you manage to check your analytics, there are 50 metrics staring back at you—and you have no idea which ones matter.
Most founders in your position feel one of two ways: either paralyzed by analysis or completely blind to what's happening. Neither is ideal, but the second is worse. You need just enough visibility to make decisions, without it consuming your entire week.
The good news? You don't need much. A solopreneur has a massive advantage over larger teams: you can move fast. You can test something Monday and have results by Friday. You don't need enterprise-grade analytics to do that. You need clarity.
This guide strips away everything you don't need and focuses on the metrics that actually drive growth when you're running the whole show alone.
The Only 5 Metrics You Need
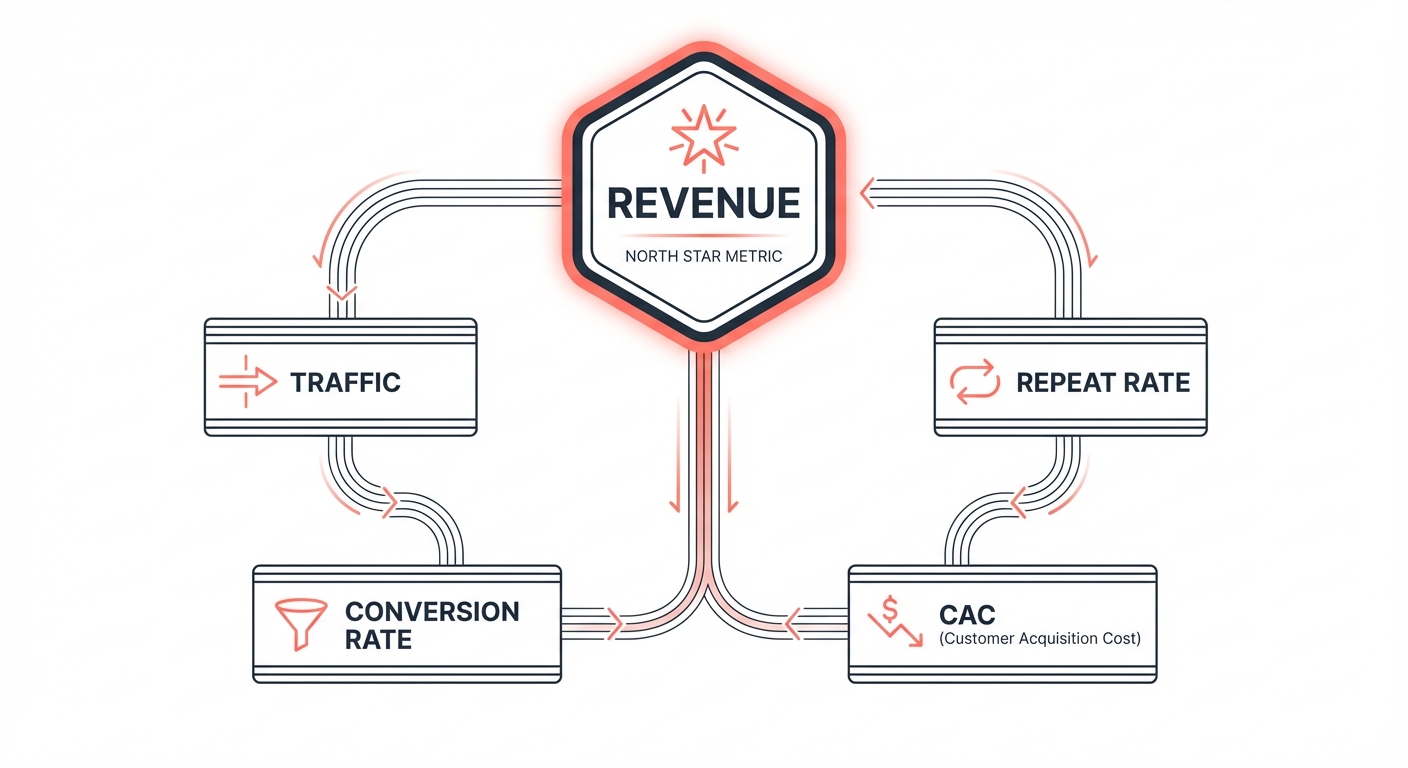 Diagram showing five core solopreneur metrics with Revenue as the north star, connected to Traffic, Conversion Rate, CAC, and Repeat Rate
Stop tracking everything. Track these five metrics, and you'll know whether your business is growing:
1. Revenue
This is the only metric that pays your bills. It's the north star. Track it weekly (even if just Monday mornings) to see if you're heading in the right direction. Monthly is fine too. The point is: you should never be surprised by how much money came in.
2. Customer Acquisition Cost (CAC)
This tells you how much you're paying per new customer. It's simple: divide your total marketing spend by the number of new customers. Know this number. Compare it to how much a customer is worth over their lifetime. If CAC is higher than customer value, you have a problem.
3. Traffic
Pick one traffic source—just one—and track it. Website visitors? Email list size? Social followers? Pick one that matters most to your business and stop obsessing over the others. You don't have bandwidth to optimize three channels at once.
4. Conversion Rate
How many people who see your offer actually become customers? This is visitors-to-customers (or email subscribers-to-customers). Calculate it monthly. This number matters more than traffic—a 5% conversion with 500 visitors beats a 0.5% conversion with 5,000 visitors every time.
5. Repeat Rate
What percentage of your customers buy from you again? This is the metric solopreneurs usually ignore because they're chasing new customers. Don't. Repeat purchases are how you scale without burning out.
That's it. Everything else is optional. Seriously.
Solopreneur Metrics Cheat Sheet
| Metric | Formula | How Often | Good Range | Where to Find It |
|---|---|---|---|---|
| Revenue | Total income in period | Weekly | Trending up month-over-month | Stripe, Square, PayPal |
| CAC | Marketing spend / New customers | Monthly | Less than 1/3 of customer value | Spreadsheet (manual) |
| Traffic | Primary channel visitors/subscribers | Weekly | Steady or growing | GA4, email platform |
| Conversion Rate | Customers / Visitors (or leads) | Monthly | 2-5% (varies by type) | GA4 + payment processor |
| Repeat Rate | Returning customers / Total customers | Quarterly | 20%+ decent, 40%+ excellent | Payment processor |
Why Less Is More
You've probably heard that "you can't manage what you don't measure." That's half-true. The real saying should be: "You can't manage what you measure too much."
More metrics don't lead to better decisions. They lead to confusion and time-wasting. You'll find yourself generating reports instead of selling. You'll debate what a bounce rate means instead of calling customers. You'll optimize for vanity metrics that look good in a spreadsheet but don't move the needle on revenue.
Every hour you spend analyzing is an hour you're not spending on the work that actually grows your business. As a solopreneur, your time is your scarcest resource. Treat it that way.
Focus beats breadth. Pick five metrics, understand them deeply, and move on.
Metric Deep Dives
Revenue Tracking (Keep It Simple)
You need to know if your business is growing. A simple approach: track your revenue weekly or monthly in a spreadsheet. That's it. No complex accounting required. Just the number that came in.
Create a simple two-column spreadsheet: Week/Month | Revenue. Add a trend line. You want to see the line going up over time—not necessarily every week, but over months. This tells you whether your marketing efforts are working.
Your payment processor (Stripe, Square, PayPal) already has this data. You can pull it in seconds. No fancy tools needed.
Customer Acquisition Cost
This is one of the most useful numbers you can know.
Formula: Total marketing spend / New customers = CAC
For example:
- You spent $500 on ads this month
- You gained 10 new customers
- CAC = $50
Is that good? It depends on what your customers are worth. If you make $200 per customer on average, then $50 CAC is great—you're profitable from day one. If you make $20 per customer, then $50 is a problem.
Typical CAC ranges by business type:
| Business Type | Healthy CAC Range | Notes |
|---|---|---|
| E-commerce | $15-$50 | Lower margins require lower CAC |
| Local services | $100-$200 | Higher customer value supports this |
| B2B software/SaaS | $200-$500 | Recurring revenue justifies higher cost |
| Freelancer/consultant | $50-$150 | Often organic/referral, so lower |
| Course creator | $30-$100 | Depends on course price point |
The golden rule: keep your CAC below one-third of what a customer is worth. A 3:1 ratio (customer value to CAC) is the minimum target. Below that, you're spending too much to acquire.
Track this monthly. Include all marketing spend: ads, email tools, website hosting, content tools, any software you buy specifically for marketing. You can optionally include your time (valued at your hourly rate), but that's usually not necessary for solopreneurs—your time would show every CAC is expensive, which isn't useful.
The real insight comes when you compare CAC to customer lifetime value. That conversation happens next quarter when you've got data.
Traffic (One Number)
Don't track website traffic, email signups, and social followers simultaneously. You'll spread yourself too thin, and you'll be optimizing for three different things at once.
Pick your primary traffic source. Is your business built on a mailing list? Track email subscribers. Relying on search traffic? Track monthly website visitors. Building on social? Pick one platform (not all of them) and track followers there.
The purpose isn't to boost vanity—it's to have one leading indicator that tells you if your content/ads/outreach is reaching people. When traffic is up, conversions usually follow.
One number. One dashboard. One thing to optimize. Done.
Conversion Rate
This is how many people who see your offer actually buy.
Formula: Customers this month / Visitors (or prospects) this month = Conversion rate
Example: 1,000 website visitors, 20 bought. Conversion rate: 2%.
For email-driven businesses: 5,000 subscribers, 50 purchased. Conversion rate: 1%.
Conversion rate benchmarks by business type:
| Business Type | Typical Range | Strong Performance |
|---|---|---|
| E-commerce | 1-3% | 3%+ |
| B2B services | 2-5% | 5-8% |
| SaaS / software | 2-4% | 4-7% |
| Digital products / courses | 3-10% | 10%+ |
| Freelance / consulting | 5-15% | 15%+ (warm leads) |
Calculate this monthly. This metric often matters more than traffic. A 2% conversion rate with 1,000 visitors (20 customers) beats a 0.5% conversion rate with 10,000 visitors (50 customers) in terms of efficiency—but only if you're profitable at 2%.
Here's the solopreneur play: focus on improving conversion rate before chasing more traffic. It's cheaper and faster. Test a different headline. Improve your landing page copy. Clarify your value proposition. Small improvements to conversion compound faster than trying to double your traffic.
Repeat Purchase / Retention
How many customers come back and buy again?
Formula: Customers who purchased twice / Total customers = Repeat rate
Track this quarterly (not weekly—you'll drive yourself crazy watching it). A 20% repeat rate is decent for many solopreneurs. 40%+ is excellent.
Why is this buried here instead of at the top? Because most solopreneurs obsess about acquisition while ignoring retention. It's backward. A customer who buys twice is worth twice as much as a customer who buys once—but the second sale is almost free compared to the acquisition cost of the first.
Start tracking this now. In six months, when you have data, you might realize that improving retention by 10% grows your revenue more than doubling your customer acquisition effort. Most solopreneurs never test this hypothesis because they're not tracking it.
How These Metrics Work Together: A Real Example
Here's how the five metrics connect in practice. Say you run an online course business:
- Revenue: $4,000/month
- Traffic: 2,000 website visitors/month
- Conversion rate: 2% (40 customers)
- CAC: You spent $800 on ads, so $800 / 40 = $20
- Repeat rate: 25% of past customers buy your next course
Your customer pays $100 per course. CAC is $20. That's a 5:1 ratio—healthy. Your repeat rate means one in four customers comes back, effectively giving you $125 per customer on average without spending another dollar to acquire them.
Now suppose traffic doubles to 4,000 but conversion drops to 1%. You still get 40 customers, but you're working twice as hard for the same result. The conversion rate told you something was wrong before revenue showed it.
Or suppose your repeat rate jumps to 40%. That same $800 in ads now generates not just 40 first-time buyers but 16 repeat buyers—56 total sales from $800 in spend. Your effective CAC drops to $14.
This is why all five metrics matter together. One number in isolation is a data point. Five numbers together tell a story.
Metrics Red Flags
Not sure when to worry? These specific numbers signal a problem:
| Red Flag | What It Means | What to Do |
|---|---|---|
| Revenue down 3+ weeks in a row | Sustained decline, not just a bad week | Check traffic and conversion—find the bottleneck |
| CAC exceeds customer value | You're losing money on every customer | Cut ad spend, improve conversion, or raise prices |
| Traffic dropping 20%+ month-over-month | Your reach is shrinking | Check for algorithm changes, content gaps, or broken campaigns |
| Conversion rate below 1% | Your offer or page isn't resonating | Test headlines, simplify the page, improve your CTA |
| Repeat rate below 10% | Customers aren't coming back | Survey past customers, improve the product, add follow-up emails |
| CAC rising while revenue is flat | Acquisition is getting more expensive | Diversify channels, double down on organic, optimize existing campaigns |
If none of these red flags apply, you're doing fine. Don't overthink it.
What NOT to Track
You have permission—from me, from marketing managers everywhere—to ignore these metrics:
Social media likes and comments. Unless you're selling sponsorships, engagement on social posts is vanity. It makes you feel good but doesn't grow revenue. Stop checking it.
Email open rates. Unless your open rate is below 15% (which indicates a real problem), it doesn't matter. Opens don't equal customers. Sales do. (Note: Apple Mail Privacy Protection inflates open rates anyway, making the data unreliable.)
Bounce rate. Yes, lower is usually better. But bouncing isn't the problem—not converting is. People can arrive at your site, bounce, and still think you're great. Or they can spend 10 minutes on your site and never buy. Bounce rate distracts you from conversion rate.
Time on site. Is it actionable? Not really. A customer who buys in 30 seconds is more valuable than someone who spends 20 minutes reading and leaves.
Follower counts. This is pure vanity. Focus on followers who actually care, not total count. (And honestly, you'd know who cares by looking at engagement and conversions, not follower count.)
These metrics feel important because platforms emphasize them and they're easy to measure. They distract you from what actually matters. Ignore them.
The 15-Minute Weekly Review
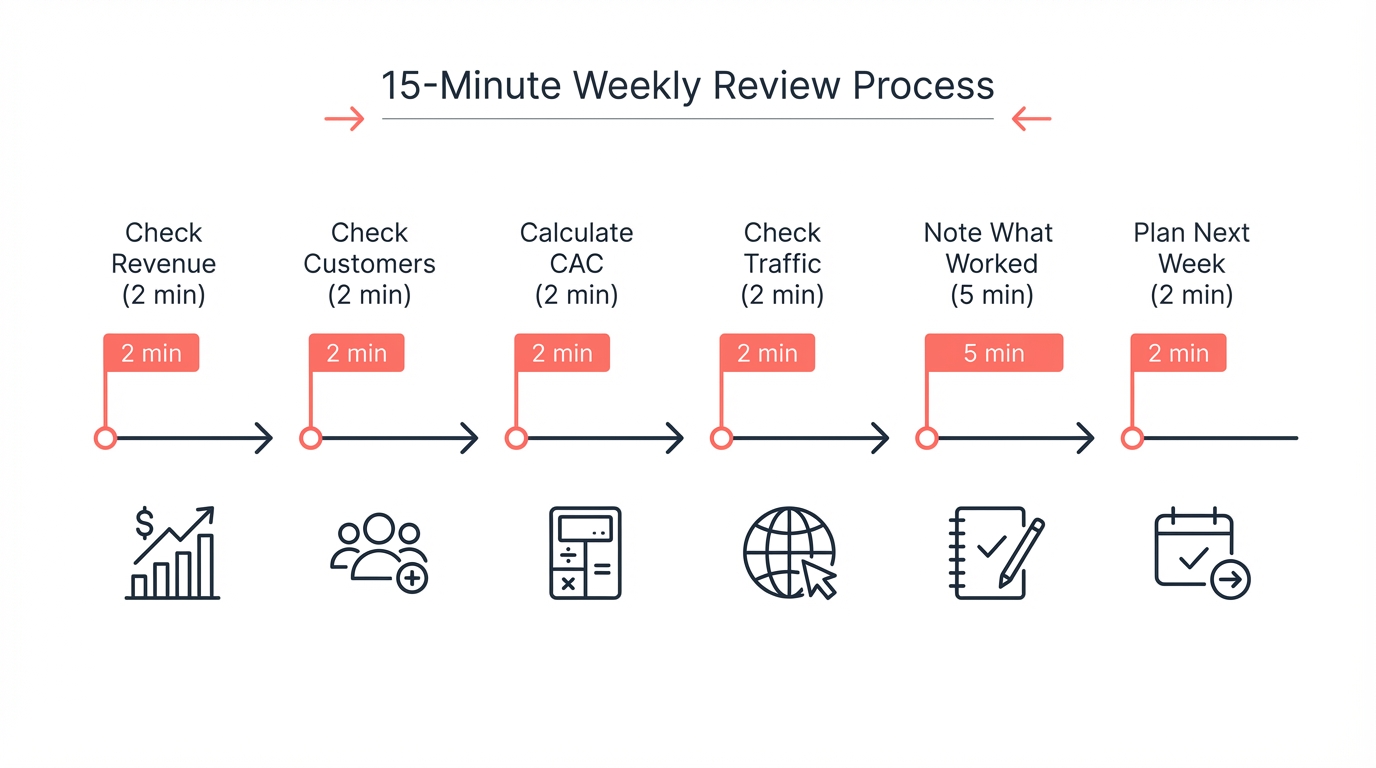 Diagram showing the 15-minute weekly review process in six steps from checking revenue to planning next week
Every Sunday night (or whatever works for you), do this 15-minute ritual:
-
Check revenue (2 min): Open your payment processor. How much came in this week? Write it in your spreadsheet. Trend up or down?
-
Check new customers (2 min): How many new people bought? Write it down.
-
Calculate CAC (2 min): How much did you spend on marketing this week? Divide by new customers. Getting better or worse?
-
Check main traffic source (2 min): Did your primary metric (email list, website visitors, whatever) go up this week? Good or bad?
-
Note what worked (5 min): What did you do this week that moved the needle? One ad? A specific email? A guest post? Write it down. This is where insights come from.
-
Decide one action for next week (2 min): Based on what you learned, what's one thing you'll try next week? More of what worked? Test something new? Write it down.
That's it. Fifteen minutes a week, and you have perfect visibility into your business. No dashboards, no reports, no complexity.
Free Solopreneur Dashboard
You don't need a fancy tool. A Google Sheet works perfectly:
Columns: Week | Revenue | New Customers | CAC | Traffic | Conversion Rate | Notes
Add a row each week. In 12 weeks, you'll see patterns emerge. Add a simple line chart for revenue—seeing that line go up is motivating.
That's your "dashboard." Print it out if it helps. Refer to it before making marketing decisions.
Need a starting template? Create a new Google Sheet with those columns and you're done. Seriously.
When to Graduate to More Metrics
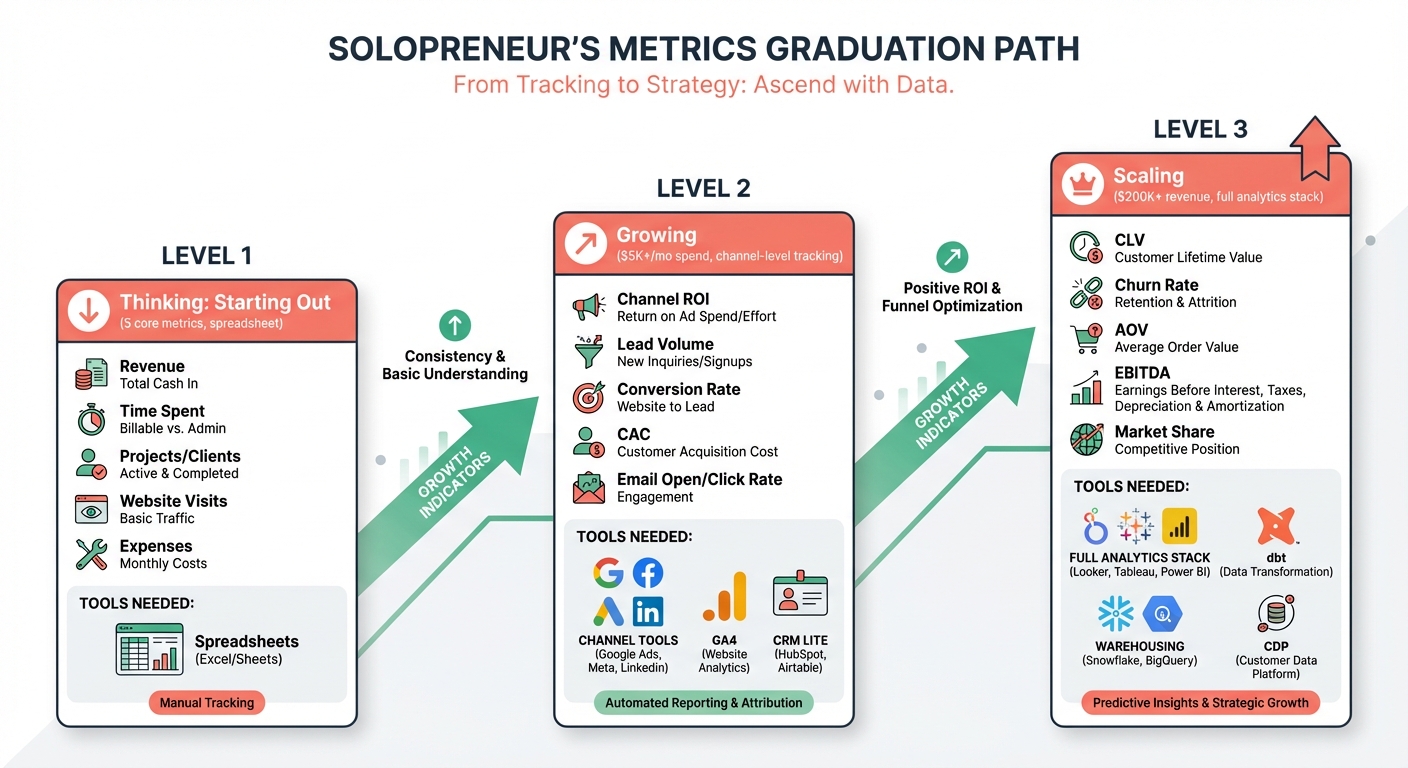 Diagram showing the solopreneur metrics graduation path from Level 1 Starting Out through Level 2 Growing to Level 3 Scaling
You don't need additional metrics until you hit certain milestones. If you're not there yet, stop reading this section and stay focused on the five metrics above.
Graduate to more sophisticated tracking when:
-
You're spending $5,000+ per month on marketing. At that scale, understanding channel performance (which ads convert best?) becomes crucial. Start tracking metrics by channel.
-
You have multiple traffic sources. If you're running ads, doing SEO, building an email list, and doing social, you need channel-level data. Not before.
-
You're hiring marketing help. Once you hire someone or outsource parts of your marketing, you need more granular metrics to brief them and evaluate their work.
-
Your revenue is $200K+ annually. At this scale, your business is stable enough to invest in sophisticated analytics. You can afford the time and tools.
Until then, keep it simple.
What Each Level Looks Like
| Stage | Revenue | Metrics to Track | Tools |
|---|---|---|---|
| Starting out | Under $50K/year | 5 core metrics | Spreadsheet + payment processor |
| Growing | $50K-$200K/year | Core + channel-level CAC, email metrics, lead source | GA4 + email platform + CRM lite (Airtable) |
| Scaling | $200K+/year | Full funnel: CLV, churn, AOV, channel ROAS, attribution | Analytics platform + data warehouse |
Most solopreneurs stay at level one for their first 1-2 years. That's fine. Graduate when the data demands it, not when a marketing blog tells you to.
Metrics by Business Type
Different solopreneurs should emphasize different metrics. Here's what to focus on:
E-commerce Solopreneur
Focus on: Revenue, AOV (Average Order Value), Repeat rate, ROAS (Return on Ad Spend)
Shopify analytics gives you everything you need. You don't need additional tools.
Service Business Solopreneur
Focus on: Leads, Close rate, Customer value, Repeat rate
Who contacts you? How many turn into customers? That's your conversion funnel. Track it in a spreadsheet.
Content/Course Creator
Focus on: Email list size, Email conversion rate, Revenue per subscriber
Your email platform (ConvertKit, Substack, etc.) has everything you need. Don't obsess over open rates.
Freelancer
Focus on: Leads (proposals received), Close rate (proposals won), Client value
Keep a simple spreadsheet: when did you pitch? Did it close? How much? You'll know instantly how your pipeline looks.
Tool Recommendations (Keep It Simple)
You need three things: visibility into traffic, visibility into revenue, and a place to think.
Google Analytics 4 (free): Basic traffic data. Set it up once, forget about it, check it weekly. Go to Reports > Acquisition > Traffic acquisition to see where visitors come from. The Conversions report shows what actions people take. That's all you need—ignore the rest of GA4. If GA4 feels overwhelming, Plausible is a simpler, privacy-friendly alternative (paid, but affordable).
Your payment processor's dashboard: Stripe, Square, PayPal—whatever you use. It has all your revenue data. In Stripe specifically, the Revenue section under Analytics shows weekly/monthly trends, and the Customers section shows new vs. returning. That covers revenue and repeat rate in one view.
A spreadsheet: Google Sheets, Excel, doesn't matter. This is where you record weekly metrics and spot trends.
That's your entire stack. Seriously.
Don't buy:
- Expensive analytics platforms (Mixpanel, Amplitude, etc.)
- Complex dashboarding tools
- Marketing automation platforms you don't have time to use
- Multiple platforms for different data
One of the biggest mistakes solopreneurs make is buying analytics tools before they need them. You don't need a tool until you're ready to use it well. A spreadsheet beats a tool you don't understand.
Common Solopreneur Mistakes
Tracking too many metrics. You have 20 open dashboards, 5 are important, and 15 are distracting you. Close 15 of them. This is the most common mistake.
Buying tools before needing them. You get seduced by a cool analytics platform and sign up before you even have the data to analyze. Spreadsheet first, fancy tools much later.
Comparing yourself to funded startups. You read a case study about how TechCo's $2M funding got them to 50% month-over-month growth, and you feel bad because you're at 5%. Funded companies optimize for growth at all costs. You optimize for sustainable profitability. These are different games.
Ignoring retention for acquisition. Chasing new customers while ignoring repeat customers is like filling a bucket with a hole in it. Fix the hole first.
Spending analysis time instead of selling time. The real mistake is analyzing for hours when you should be calling prospects, testing new channels, or improving your product. Analysis should be 10% of your week. Selling should be 40%.
Not tracking anything at all. The opposite extreme. Some solopreneurs avoid numbers entirely because they feel overwhelming. Fifteen minutes a week with five numbers is not overwhelming. It's empowering. You can't improve what you don't measure—but you only need to measure five things.
FAQ
Q: What's the most important marketing metric for a solopreneur?
Revenue. Everything else is a leading indicator of revenue. If revenue is growing, you're doing something right.
Q: How often should I check my analytics?
Weekly, in a 15-minute review. More than that and you're optimizing for noise. Less than that and you might miss important trends.
Q: Do I need marketing analytics software?
No. Google Analytics (free) + spreadsheet is enough until you hit $5K+ monthly ad spend.
Q: What's a good conversion rate for a small business?
It depends on your business model, but 2-5% is solid for most solopreneurs. B2B services might be 0.5-1%. E-commerce might be 1-3%. Digital products might be 3-10%. Don't compare yourself to someone else—compare yourself to yourself. Is it improving?
Q: Should I track customer lifetime value?
Eventually, yes. But not yet. Track repeat rate first. When you see customers buying twice, you'll naturally wonder how much they're worth over their lifetime. That's when LTV matters.
Q: What's a healthy CAC-to-LTV ratio?
Aim for 3:1 or higher—meaning each customer should be worth at least three times what you spent to acquire them. Below 3:1, you're spending too aggressively on acquisition. Above 5:1 is excellent and means you likely have room to invest more in growth.
The Bottom Line
Track less. Focus more. Your metrics should fit on one page and take 15 minutes a week to review.
Revenue is what matters. Everything else is interesting context. Simple systems beat complex ones every time. Don't let analytics become an excuse not to sell.
As your business grows, you can add sophistication. Right now, at this stage, you need clarity and speed. Five metrics. One spreadsheet. Fifteen minutes weekly.
That's how you stay sane, stay focused, and actually grow.
Related Posts

The Complete Guide to Marketing Data (For Non-Technical Teams)
Everything you need to know about marketing data - without the jargon. A practical guide for marketers who aren't data engineers.

SMB Marketing Benchmarks 2026: What 'Good' Actually Looks Like
Marketing benchmarks specifically for small businesses. Real data on ROAS, CAC, conversion rates, and more - not enterprise metrics.

What's a Good ROAS? Benchmarks by Industry and Ad Spend
ROAS benchmarks by industry, ad platform, and budget size. Learn what 'good' really means for your business and how to improve it.
Ready to see your marketing data?
Start your free trial today. See your data in 5 minutes.
Start Free Trial